S amp P 500 charts another equity market sell off imminent
In quieter days like today, it is not a bad habit to do some homework and study your long-term charts and see through the market noise in order to figure out the underlying trend. For the US stock markets, the best gauge is perhaps the S&P 500. Below we have both the daily and the weekly charts that we’d like to draw your attention to.
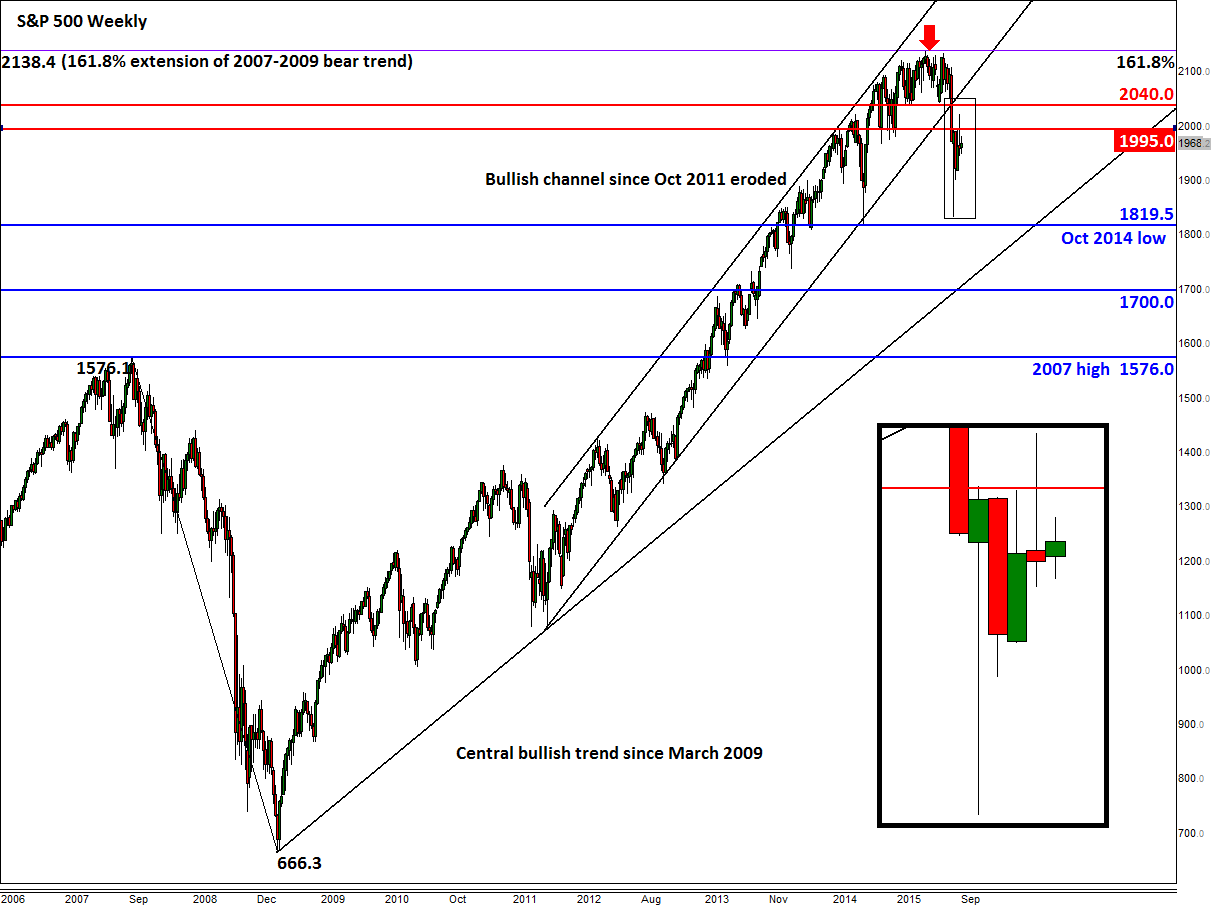
As can be seen from the weekly chart, the multi-year rally has evidently peaked this year around an exhaustion area of 2135/40, which corresponds with the 161.8% Fibonacci extension level of the entire 2007-2009 bear trend. After climbing to this area, the index has gone on to break outside of a strong long-term bullish channel, before dropping sharply in the middle of last month, followed by a period of stabilisation that has lasted for about a month now.
But when long-term bullish trends end, it is very common for the markets to stage strong counter-trend rallies that last several days to weeks, before a fresh wave of selling takes place. This is because most people will still be looking for trades that had worked well in the past: “buying the dips,” in the case of stocks. However, astute traders would use these counter-trend moves to reduce their long exposures and some would increase their short bets. As a result, this typically precedes another sharp leg lower before it becomes clear to most people that the trend has in fact changed.
Although at this stage it is still too early to say whether the markets have indeed peaked, the technical evidence in front of us suggests this may well be the case. And now that we have had a decent recovery, the probabilities of another leg lower have increased.
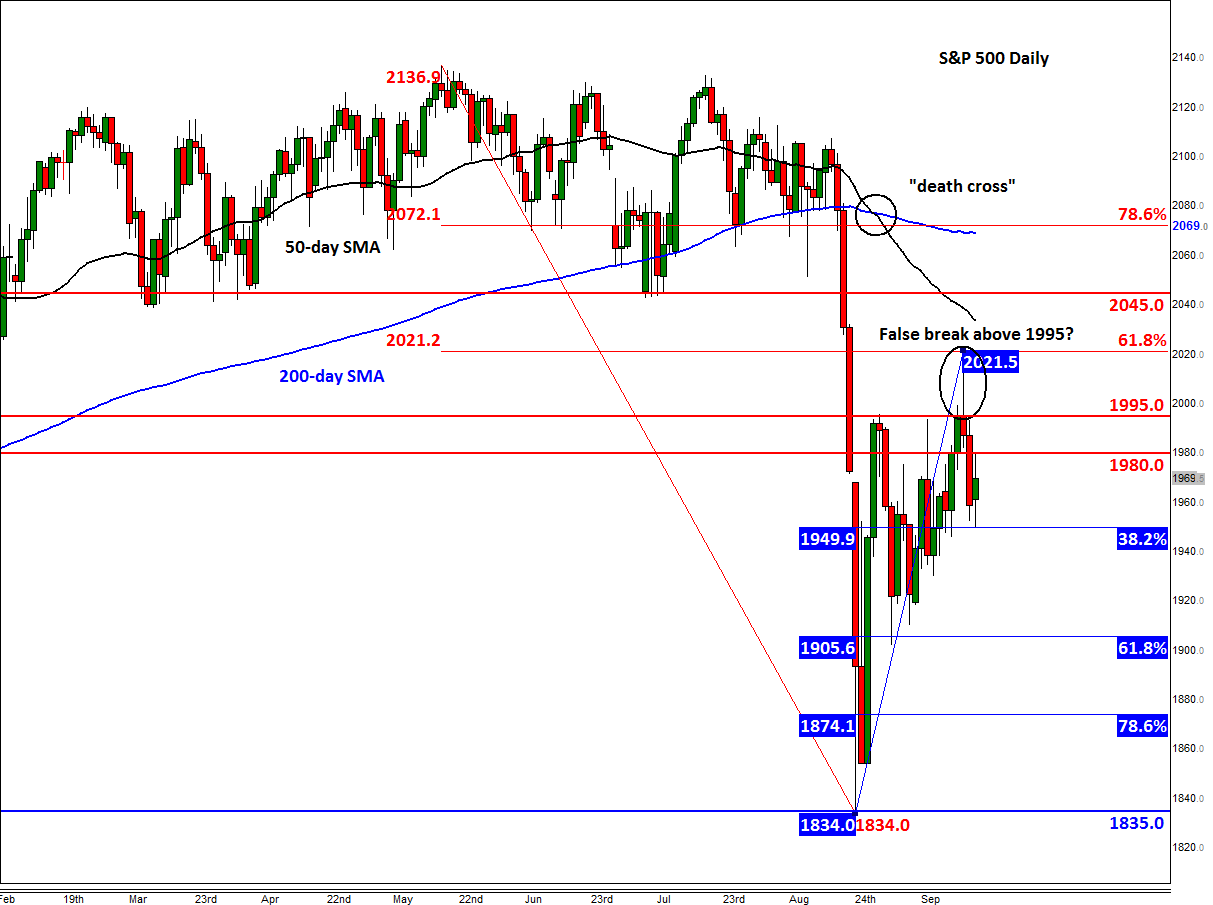
Last week saw the index momentarily break through the key 1995 resistance level. But the bulls were unable to hold their ground there for long because the rally quickly ran out of steam at the 61.8% Fibonacci retracement level of the move down from the record high, at 2021 (see the daily chart). The resulting sell-off created an inverted hammer candlestick on the weekly chart of the S&P, a technical pattern which points to further weakness – particularly if the low of this signal candle is breached decisively now.
The low from last week was around 1946, a level which incidentally also roughly corresponds with the 38.2% Fibonacci retracement of the most recent upswing. If this level breaks down, the sellers may then target the 61.8% retracement level of this move at 1905 at the very least. The 78.6% retracement level comes in at 1874, followed by the August low at just below 1835 and then the October low at 1820. These will be among the bearish targets in case we do see a move to the downside this week.
Meanwhile on the upside, the key resistance levels for the S&P are at 1980, followed by the above-mentioned resistance level of 1995 and the 61.8% Fibonacci retracement at 2021. If the latter breaks then the index may go on to test the next resistance at 2045 or even the 78.6% Fibonacci level at 2072, before deciding on its next move.
StoneX Financial Ltd (trading as “City Index”) is an execution-only service provider. This material, whether or not it states any opinions, is for general information purposes only and it does not take into account your personal circumstances or objectives. This material has been prepared using the thoughts and opinions of the author and these may change. However, City Index does not plan to provide further updates to any material once published and it is not under any obligation to keep this material up to date. This material is short term in nature and may only relate to facts and circumstances existing at a specific time or day. Nothing in this material is (or should be considered to be) financial, investment, legal, tax or other advice and no reliance should be placed on it.
No opinion given in this material constitutes a recommendation by City Index or the author that any particular investment, security, transaction or investment strategy is suitable for any specific person. The material has not been prepared in accordance with legal requirements designed to promote the independence of investment research. Although City Index is not specifically prevented from dealing before providing this material, City Index does not seek to take advantage of the material prior to its dissemination. This material is not intended for distribution to, or use by, any person in any country or jurisdiction where such distribution or use would be contrary to local law or regulation.
For further details see our full non-independent research disclaimer and quarterly summary.
CFDs are complex instruments and come with a high risk of losing money rapidly due to leverage. 69% of retail investor accounts lose money when trading CFDs with this provider. You should consider whether you understand how CFDs work and whether you can afford to take the high risk of losing your money. CFD and Forex Trading are leveraged products and your capital is at risk. They may not be suitable for everyone. Please ensure you fully understand the risks involved by reading our full risk warning.
City Index is a trading name of StoneX Financial Ltd. Head and Registered Office: 1st Floor, Moor House, 120 London Wall, London, EC2Y 5ET. StoneX Financial Ltd is a company registered in England and Wales, number: 05616586. Authorised and regulated by the Financial Conduct Authority. FCA Register Number: 446717.
City Index is a trademark of StoneX Financial Ltd.
The information on this website is not targeted at the general public of any particular country. It is not intended for distribution to residents in any country where such distribution or use would contravene any local law or regulatory requirement.
© City Index 2024