S 038 P 500 looks toppish below 2170 2180
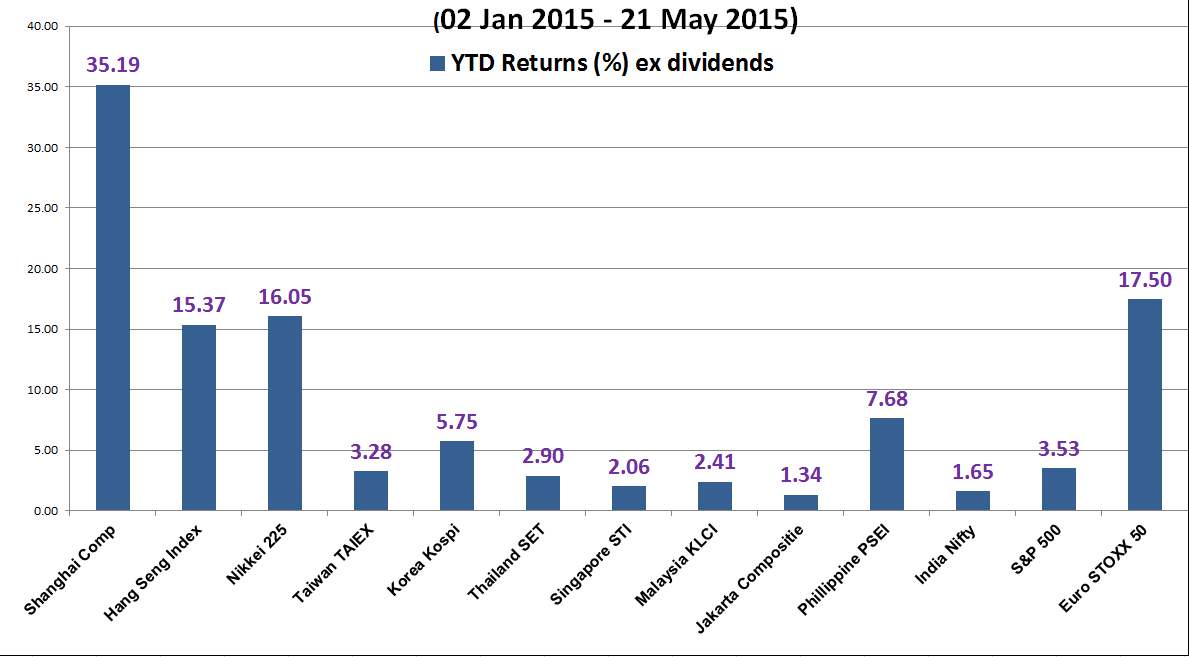
As seen from the year-to-date performance (ending 21 May 2015) of the major and Asian stock indices, the S&P 500 has recorded a lacklustre performance of 3.53%. This dismal performance of S&P 500 is way below its counterparts such as the Euro STOXX 50 (+17.50%), Nikkei 225 (+16.05%) and Shanghai Composite (+35.19%) despite its improving economic conditions versus Europe, Japan and China.
Let’s dissect the S&P 500 from a technical analysis perspective to gauge its future expected performance.
Key elements
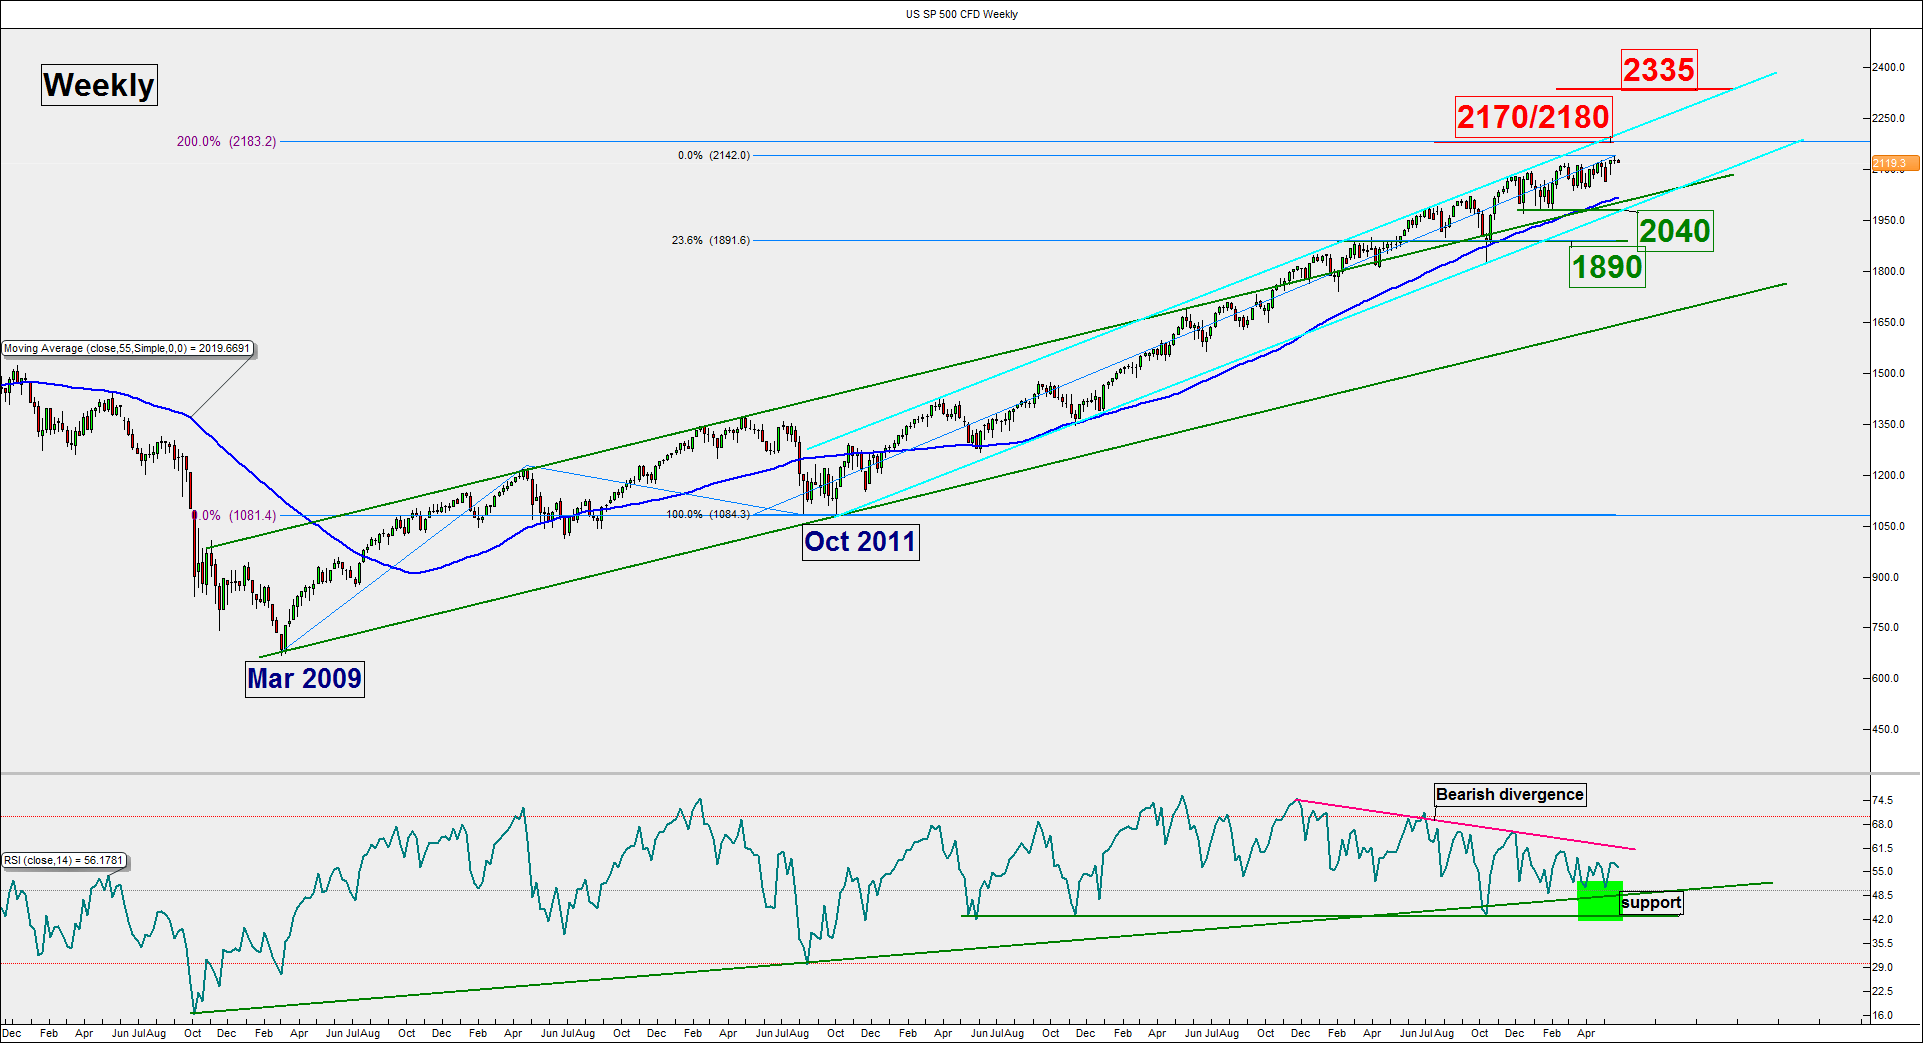
- The S&P 500 is now trading close to the upper boundary (resistance) of its long term ascending channel (in light blue) in place since 02 October 2011 low at 2170/2180 (see weekly chart below).
- The 2170/2180 resistance is a significant zone as it confluences with multiple Fibonacci projection clusters (see weekly & daily charts below).
- The long term RSI oscillator continues to flash a bearish divergence signal since late December 2013 which indicates weakness in upside momentum in price action of the Index (see weekly chart below).
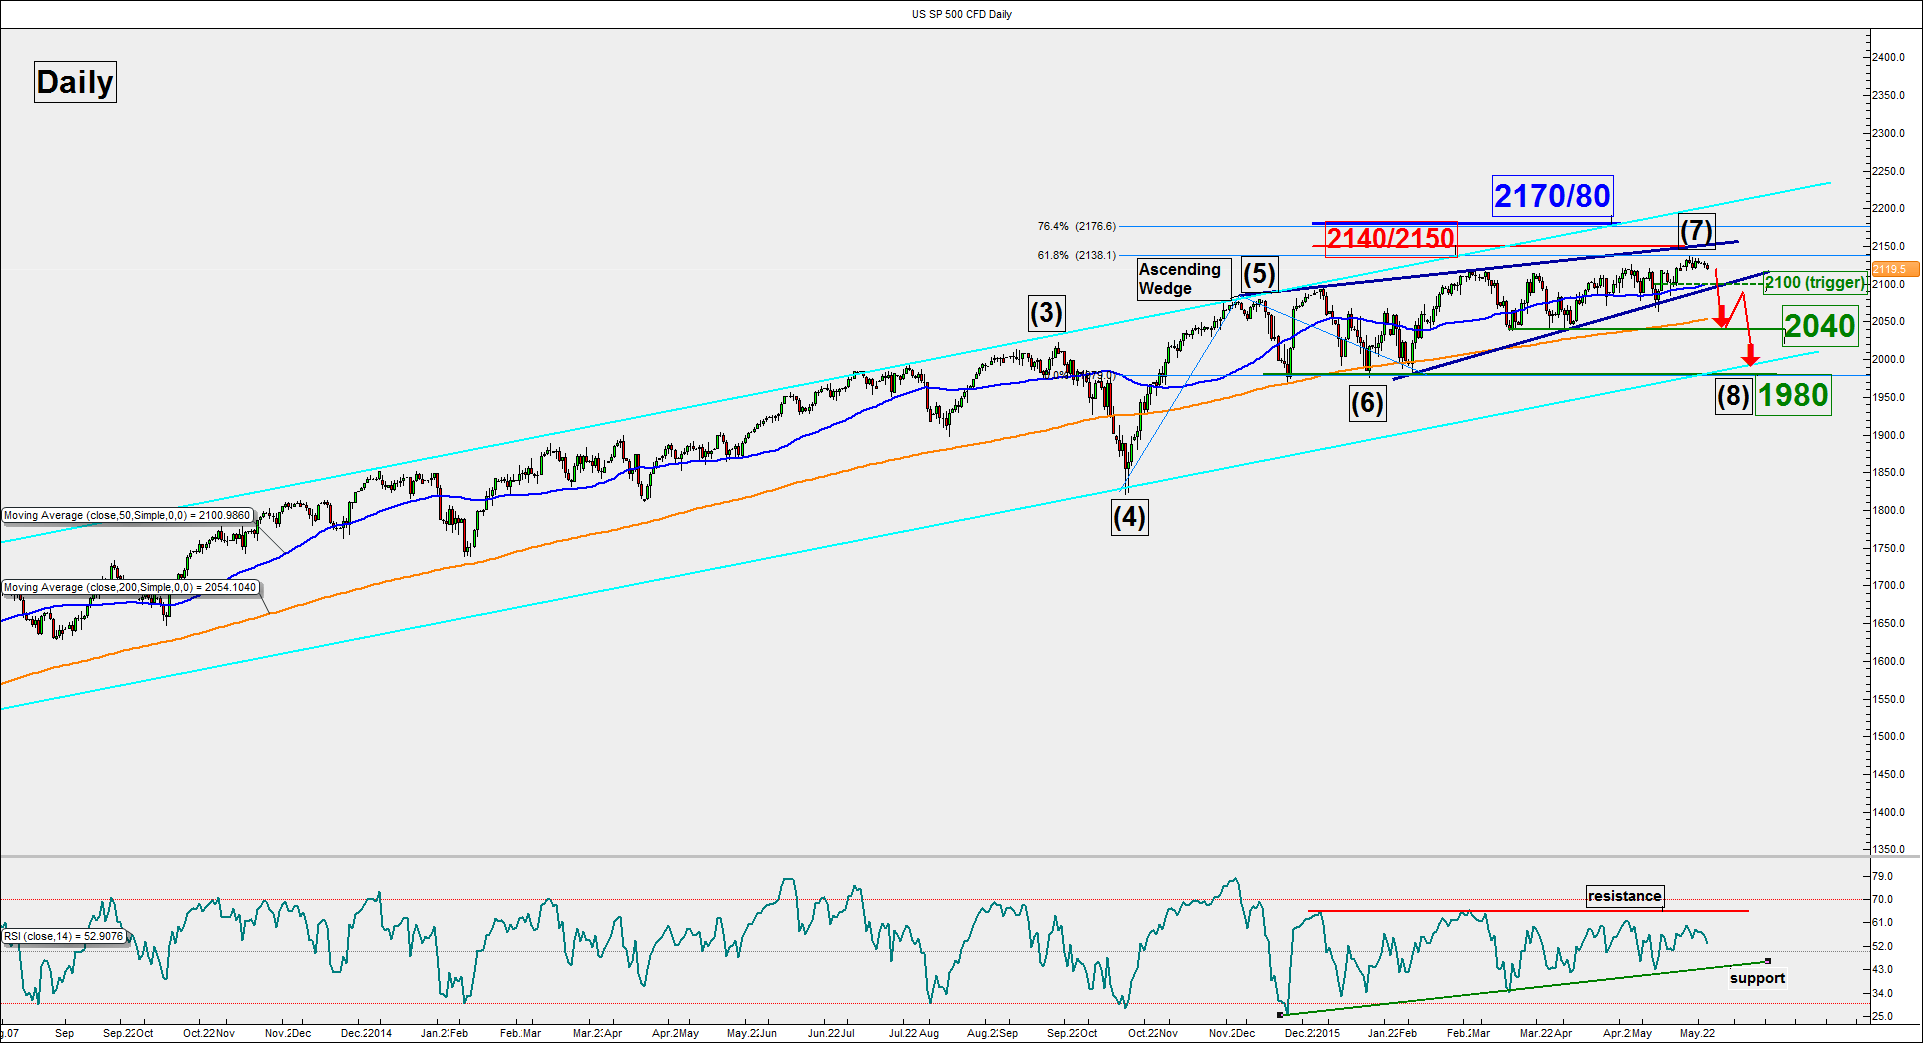
- Another weakness can been seen in the recent price action since late December 2014 as the Index has traced out an impending bearish “Ascending Wedge” configuration (in dark blue) with its upper boundary (resistance) at 2140/2150 (see daily chart below).
- The lower boundary (support) of the “Ascending Wedge” configuration stands at 2100 (see daily chart below).
- The significant supports are at 2040 which is the 200-day Moving Average (in orange) follow by the lower boundary of the long-term ascending channel (in light blue) at 1980 (see daily chart below).
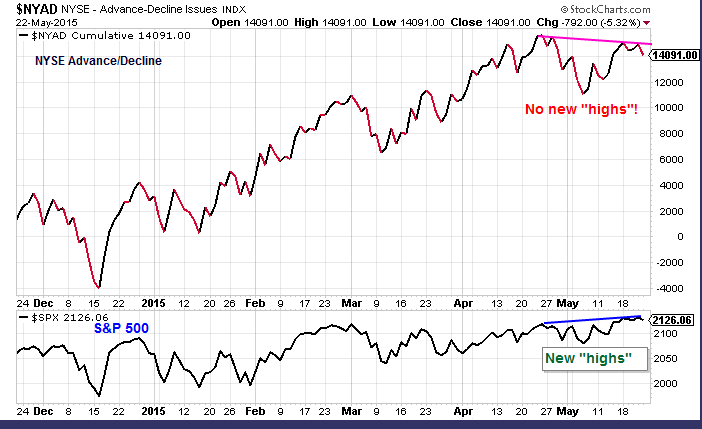
- Market breadth has started to deteriorate since 24 April 2015 as the NYSE cumulative Advance/Decline line has traced out a lower “high” despite a higher “high” seen in the S&P 500 (see chart 2).
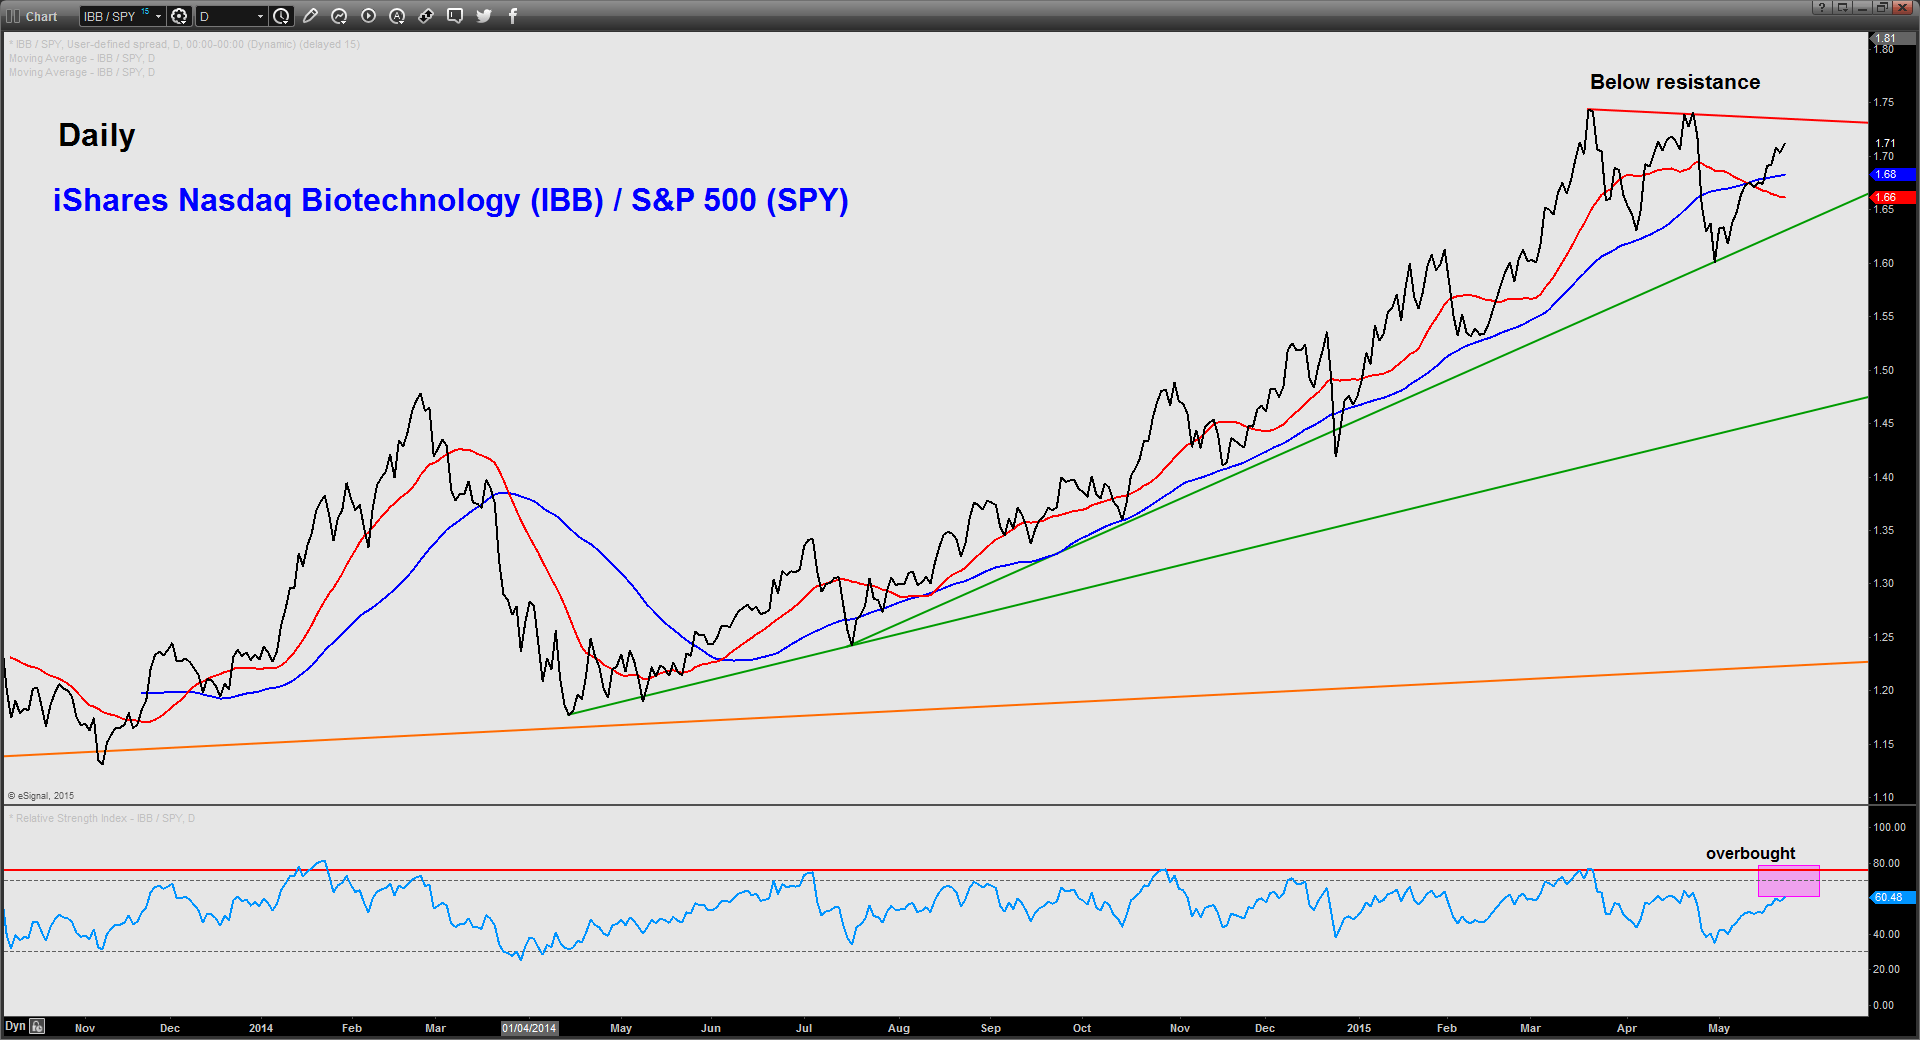
- The Biotechnology sector which is considered as a sector leader due to its superb performance seen last year (+39%) has started to underperform against the S&P 500. Its relative strength chart by taking the respective ETFs (exchange traded funds) of the Biotechnology sector (IBB) against the S&P 500 (SPY) is being capped by a graphical resistance. In addition, the RSI oscillator is coming close to its overbought region. This weakness seen in a sector leader warrants caution on the broader market (see chart 3).
Chart 2:
Chart 3:
Key levels (1 to 3 months)
Intermediate resistance: 2140/2150
Pivot (key resistance): 2170/2180
Support: 2100, 2040 & 1980
Next resistance: 2335
Conclusion
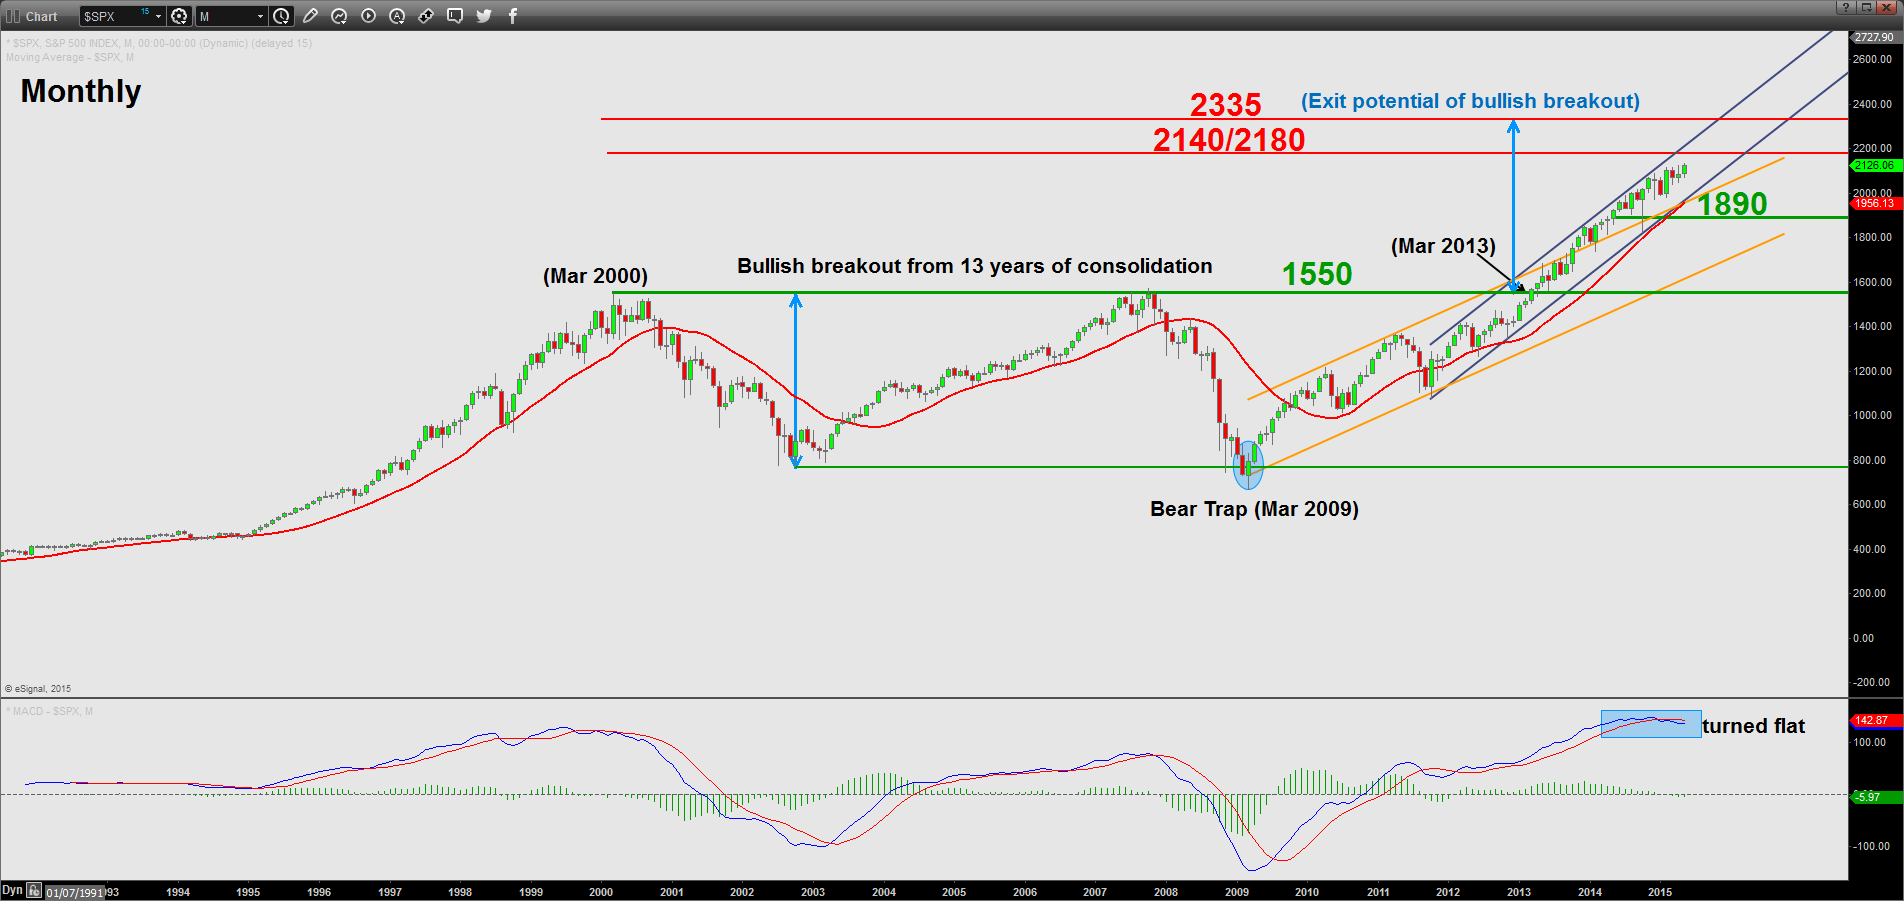
The S&P 500 (US SP 500) is coming close to a key inflection level of 2140/2150 with deteriorating technical elements. As long as the 2170/2180 pivotal resistance is not surpassed, the Index faces the risk of a significant “min correction” of 5% to 6%. A break below 2100 is likely to add impetus for this potential steep decline towards 2040 before 1980. Do note that the long-term bullish trend is still intact (see monthly chart above).
On the other hand, a clearance above 2180 is likely to invalidate the bearish view to open up scope for a multi-month upside movement to target the next resistance at 2335.
StoneX Financial Ltd (trading as “City Index”) is an execution-only service provider. This material, whether or not it states any opinions, is for general information purposes only and it does not take into account your personal circumstances or objectives. This material has been prepared using the thoughts and opinions of the author and these may change. However, City Index does not plan to provide further updates to any material once published and it is not under any obligation to keep this material up to date. This material is short term in nature and may only relate to facts and circumstances existing at a specific time or day. Nothing in this material is (or should be considered to be) financial, investment, legal, tax or other advice and no reliance should be placed on it.
No opinion given in this material constitutes a recommendation by City Index or the author that any particular investment, security, transaction or investment strategy is suitable for any specific person. The material has not been prepared in accordance with legal requirements designed to promote the independence of investment research. Although City Index is not specifically prevented from dealing before providing this material, City Index does not seek to take advantage of the material prior to its dissemination. This material is not intended for distribution to, or use by, any person in any country or jurisdiction where such distribution or use would be contrary to local law or regulation.
For further details see our full non-independent research disclaimer and quarterly summary.
CFDs are complex instruments and come with a high risk of losing money rapidly due to leverage. 69% of retail investor accounts lose money when trading CFDs with this provider. You should consider whether you understand how CFDs work and whether you can afford to take the high risk of losing your money. CFD and Forex Trading are leveraged products and your capital is at risk. They may not be suitable for everyone. Please ensure you fully understand the risks involved by reading our full risk warning.
City Index is a trading name of StoneX Financial Ltd. Head and Registered Office: 1st Floor, Moor House, 120 London Wall, London, EC2Y 5ET. StoneX Financial Ltd is a company registered in England and Wales, number: 05616586. Authorised and regulated by the Financial Conduct Authority. FCA Register Number: 446717.
City Index is a trademark of StoneX Financial Ltd.
The information on this website is not targeted at the general public of any particular country. It is not intended for distribution to residents in any country where such distribution or use would contravene any local law or regulatory requirement.
© City Index 2024