Rolls Royce shares capped by hedged outlook
Rolls-Royce is certainly not having one of the best day’s in its venerable history, but a 28 pence share fall following news of its worst-ever headline loss also suggests its most challenging episodes for decades are almost fully priced.
That’s so long as turnaround CEO Warren East is able to deliver on a planned savings run rate of about £200m by year end with cash flow generation steady on 2016.
To be sure, extended conduct risk is present, but is not high, in our view, given that the 4-year investigation by Britain’s Serious Fraud Office (SFO) has shifted from corporate to individual responsibility.
On Tuesday, that leaves Roll’s-Royce’s statutory loss as the main negative factor. It is in line with expectations, though looks some £500m-£600m higher than was widely expected. The disparity probably reflects further deterioration of RR’s hedge book after earlier assessments placed the hit around £3bn.
Investors also had a restive reaction to RR’s rather dry and narrow outlook comments. These project only “modest performance improvements” and similar free cash flow generation as in 2016. We look through this to an extent.
After all, a £200m annualised run rate in savings by year end suggests a net present value somewhat above the £80m-£110m in-year benefits. And the £671m charge for misconduct is obviously in-line. Our view is that continuing relief from the removal of the SFO’s case which has hung over sentiment for years, and the fact that underlying profit is well within projections will also go a long way towards setting the group, and its stock, off on the right foot for the year ahead. Overall, we still think Rolls probably has more room to overshoot its own cautious expectations despite risks to the outlook which clearly underlie that conservatism.
That however is not to overlook further key points that the group itself has identified as headwinds in the year ahead and beyond. We set out the main ones below.
- Marine division: it saw a £200m goodwill impairment in 2016 to reflect a more cautious outlook. Although its performance might be expected to improve in line with better fundamentals in the energy sector as oil prices rise, the timing of the write down suggests the group is seeking as much leeway as possible, aiming to manage expectations
- Dividend: having halved the dividend last year, Rolls’s first cut of pay-outs for a quarter of a century, the group kept the annual dividend at the new low rate. In all probability disappointment over that decision accounts for some of the stock price loss on Tuesday. Still, a sustained weak dividend policy would not be congruent with the history of the group, CEO East’s recent management history elsewhere, nor indeed with the free cash flow generation growth rate that’s likely to be seen under the group’s favourable outlook scenario
- Accounting changes: the forthcoming IFRS 15 accounting standard will require all companies to recognise revenues after confirmed delivery of goods. In the sphere of capital goods of the lifespan of aero engines (potentially decades) various other revenue recognition practices have become customary. Under IFRS15, the fact that the industry has relied on Maintenance, Repair and Overhaul (MRO) to drive profits, rather than an immediately accretive transaction at delivery will be exposed, to the detriment of the income statement. That suggests a negative , though transitory impact on profitability, which the group has already planned for.
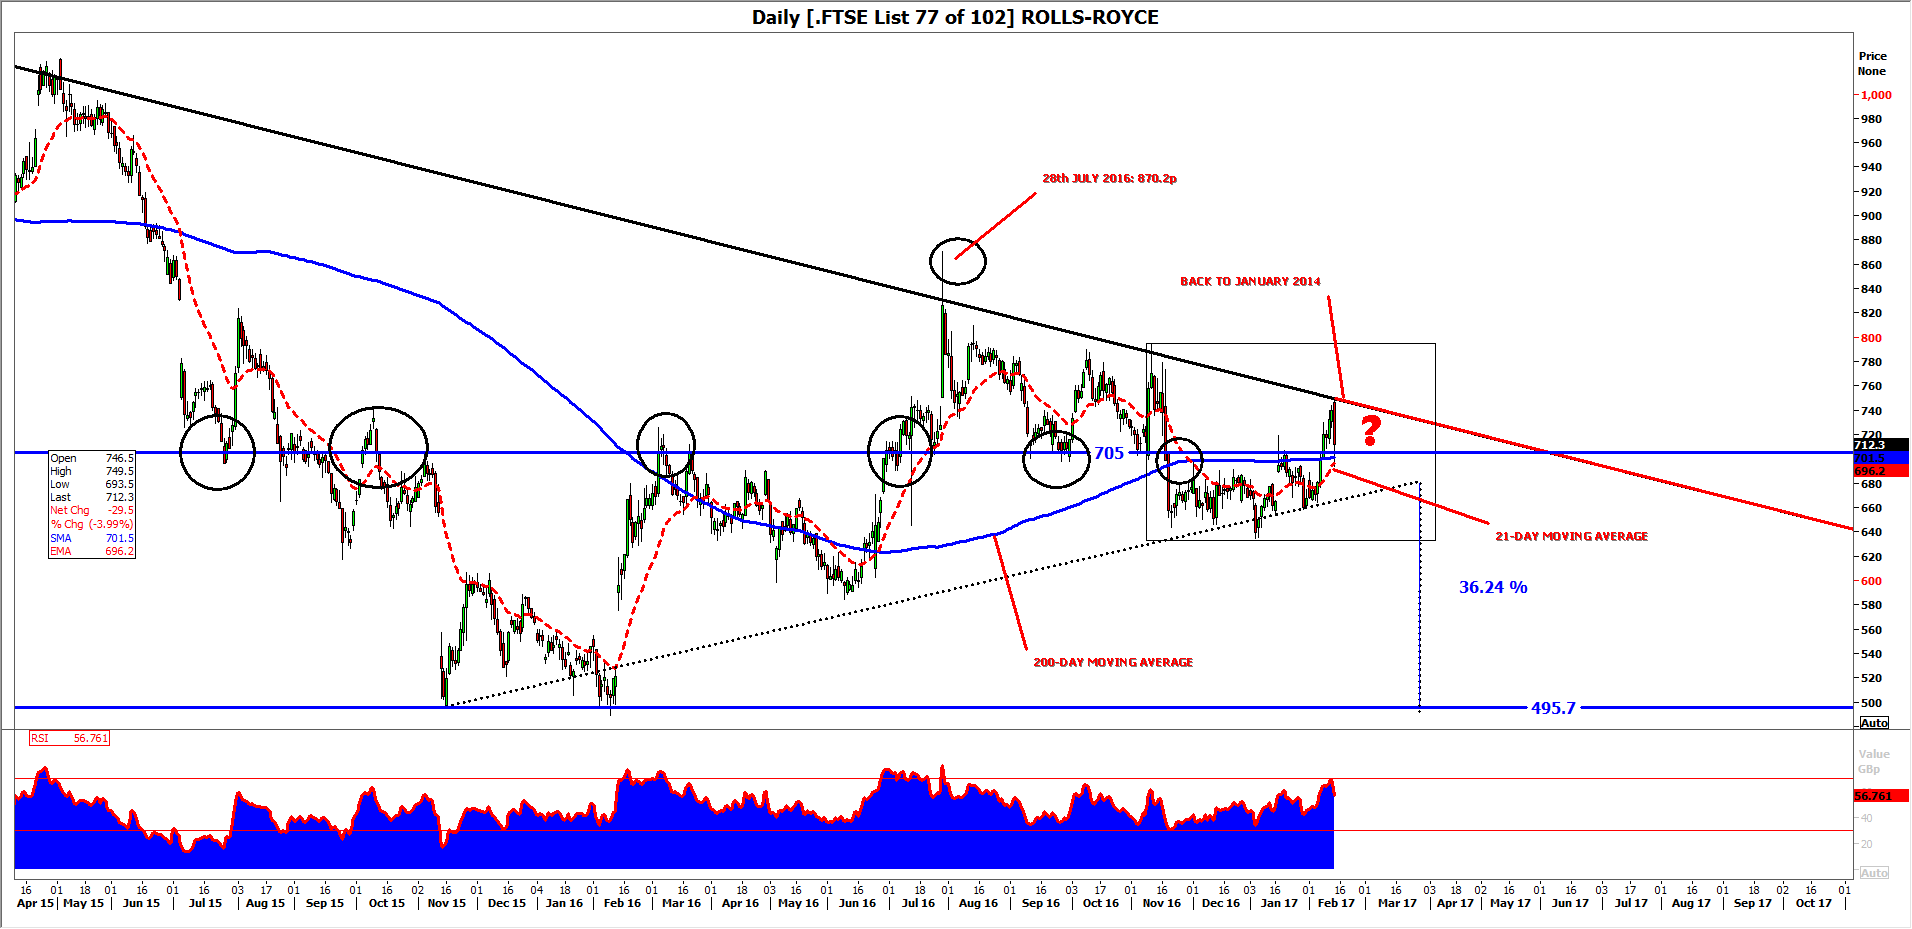
On technical charts, Rolls-Royce shares reflect not only the grinding improvement of sentiment in line with the group finally getting shot of the long-running SFO prosecution, but also continuing caution from potential challenges to the group’s outlook, be they geopolitical headwinds or execution risks.
The stock is therefore not ready to break back above a declining line that has been tagged three times since January 2014, most recently in July. Such an eventually would be among the most pivotal developments for buyers in the medium term, and would pave the way towards the next most important juncture for liquidity on the upside, the failure high on 28th July 2016.
A symmetrical wedge has arguably formed between late 2015 to date, though its imperfect definition raises questions over validity. In practice, such shortcomings may not obviate the effect, given that a significant cadre of seasoned investors will undoubtedly have the pattern, such as it is, in focus.
Whether or not a break-out is eventually seen, in line with the theoretical continuation pattern, the shares will need to hold above an obvious-to-the-naked-eye pivot at 700p-705p in the very near term, to maintain the best possible upside.
A downside breach tends to keep the break-out scenario alive, in my view, and in keeping with its continuation character, the stock would normally be expected to head lower, in line with the prevailing trend.
Assuming a target that is equal to the distance from the kick-off point of the share’s most recent and cleanest rising trend and a break down near the apex of the wedge, Rolls-Royce could settle around the five-year low seen in 2016, circa 495p. That implies a fall of some 30% below the current price.
It’s worth stressing that the most salient pattern in the stock right now isn’t perfect, meaning a sustained down move could be avoided. Support at 705p would ideally hold firm under a more bullish scenario. Watch for a failure of the 200-day moving average (blue indicator line) and/or a move below the 21-day exponential moving average (red perforated line) for pointers.
DAILY CHART: ROLLS-ROYCE PLC.
Source: Thomson Reuters and City Index – please click image to enlarge
StoneX Financial Ltd (trading as “City Index”) is an execution-only service provider. This material, whether or not it states any opinions, is for general information purposes only and it does not take into account your personal circumstances or objectives. This material has been prepared using the thoughts and opinions of the author and these may change. However, City Index does not plan to provide further updates to any material once published and it is not under any obligation to keep this material up to date. This material is short term in nature and may only relate to facts and circumstances existing at a specific time or day. Nothing in this material is (or should be considered to be) financial, investment, legal, tax or other advice and no reliance should be placed on it.
No opinion given in this material constitutes a recommendation by City Index or the author that any particular investment, security, transaction or investment strategy is suitable for any specific person. The material has not been prepared in accordance with legal requirements designed to promote the independence of investment research. Although City Index is not specifically prevented from dealing before providing this material, City Index does not seek to take advantage of the material prior to its dissemination. This material is not intended for distribution to, or use by, any person in any country or jurisdiction where such distribution or use would be contrary to local law or regulation.
For further details see our full non-independent research disclaimer and quarterly summary.
CFDs are complex instruments and come with a high risk of losing money rapidly due to leverage. 69% of retail investor accounts lose money when trading CFDs with this provider. You should consider whether you understand how CFDs work and whether you can afford to take the high risk of losing your money. CFD and Forex Trading are leveraged products and your capital is at risk. They may not be suitable for everyone. Please ensure you fully understand the risks involved by reading our full risk warning.
City Index is a trading name of StoneX Financial Ltd. Head and Registered Office: 1st Floor, Moor House, 120 London Wall, London, EC2Y 5ET. StoneX Financial Ltd is a company registered in England and Wales, number: 05616586. Authorised and regulated by the Financial Conduct Authority. FCA Register Number: 446717.
City Index is a trademark of StoneX Financial Ltd.
The information on this website is not targeted at the general public of any particular country. It is not intended for distribution to residents in any country where such distribution or use would contravene any local law or regulatory requirement.
© City Index 2024