Risk of a pull back for Hang Seng 40 above 27300 26900 before more upside
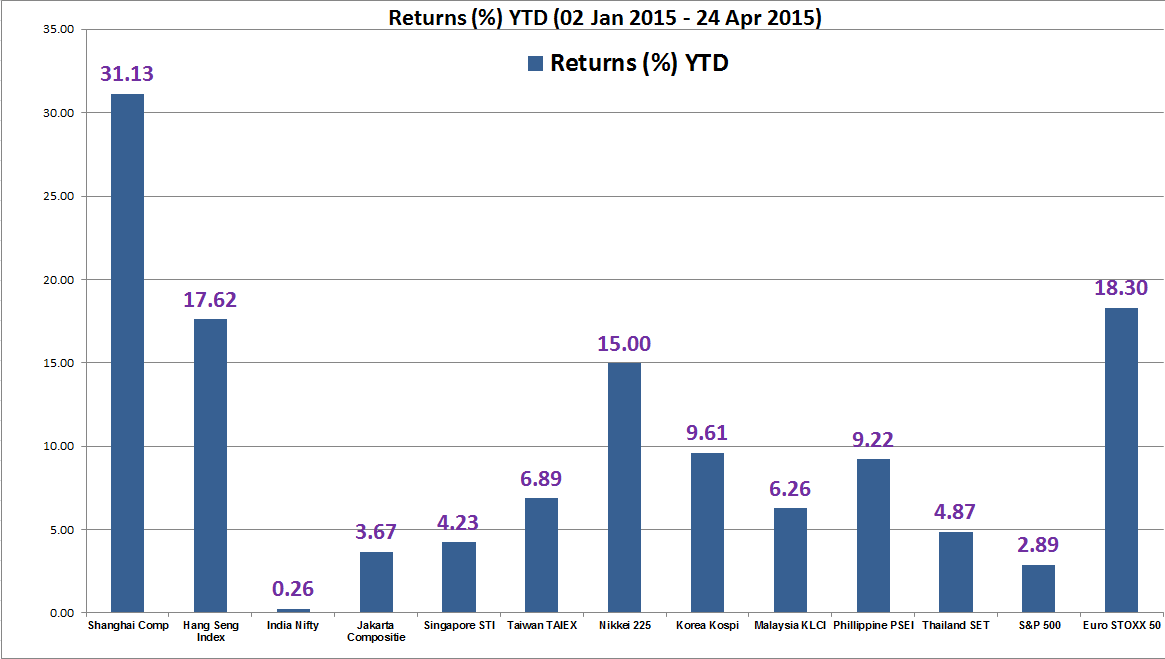
Hong Kong is the second best performing Asian stock market as her benchmark Hang Seng Index soared by 17% year to date (as at 24 April 2015) just behind the “red hot” Shanghai Composite Index (see performance chart below).
Most of the gain seen in the Hang Seng Index has been attributed in the month of April 2015 and a jump in liquidity from the Shanghai-Hong Kong Stock Connect program (a catch up play in terms of performance after lagging behind the Shanghai Composite since last year).
Let us take a look at its technical elements to decipher its expected performance going forward.
Key elements
- The Index is now testing the median line (resistance) of its long-term ascending channel (in green) in place since 26 October 2008 at 28600 (see weekly chart).
- The long-term MACD trend indicator continues to trend upwards steadily above its centreline and it still has room before reaching its “extreme” level seen in October 2007. This observation suggests that the on-going multi-month bullish trend remains intact (see weekly chart).
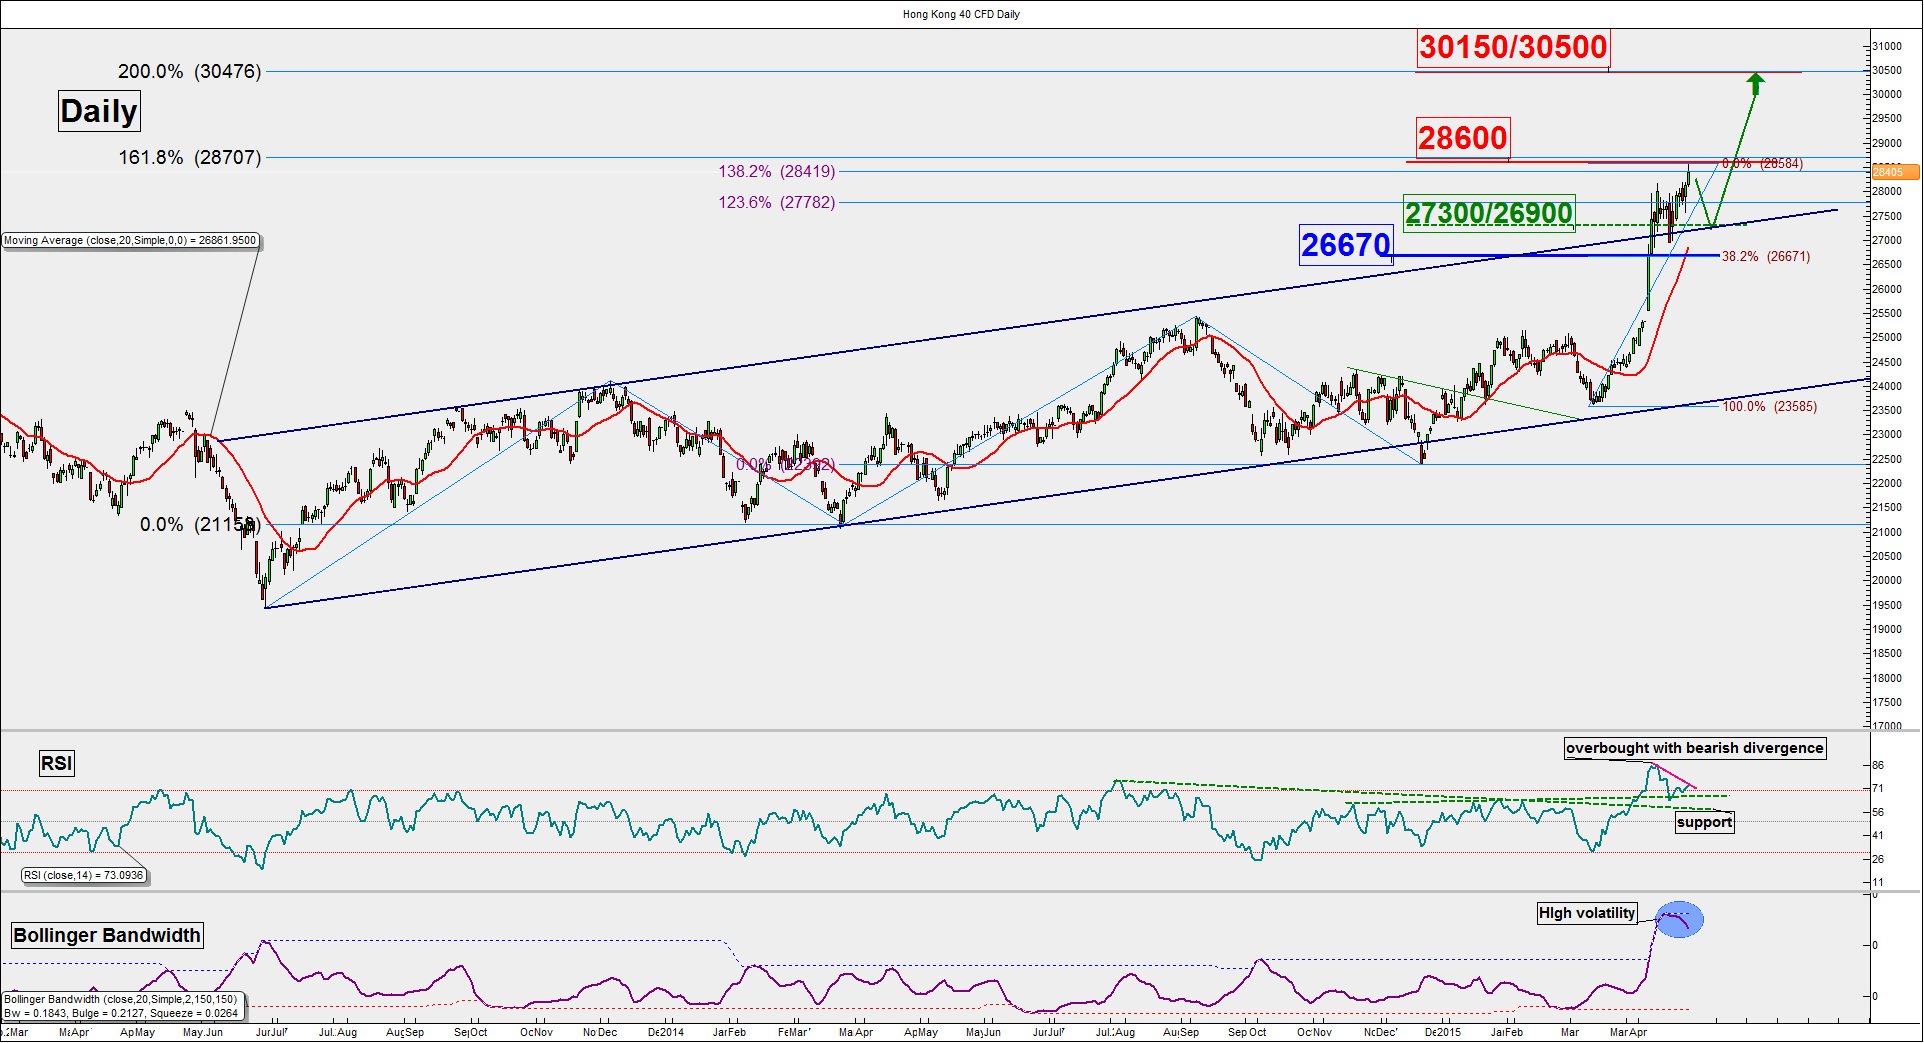
- The intermediate term RSI oscillator is overbought and has flashed a bearish divergence signal (see daily chart).
- The intermediate term Bollinger Bandwidth indicator which measures volatility remains at a 14-month high since 05 February 2014. This observation suggests that the current uptrend from 11 March 2015 low is “overstretched” and the Index is likely to see a pull-back/consolidation (see daily chart).
- The pull-back support of the former intermediate term ascending channel breakout (from 26 June 2013 low, in dark blue) is at 26900 (see daily chart).
- The 26900 also coincides closely with the38.2% Fibonacci retracement (typical wave 4 target) from 11 march 2015 low to current 27 April 2015 high (see daily chart).
- The upward sloping 20-day Moving Average (in red) is acting as support at 26670 (see daily chart).
Key levels (1 to 3 months)
Intermediate support: 27300/26900
Pivot (key support):26670
Resistance: 30150 & 30500
Next support: 25150/25000
Conclusion
Intermediate term mathematical indicators (Bollinger Bandwidth & RSI oscillator) as seen on the daily chart highlights the risk of a pull-back first towards 27300/26900.
As long as the 26670 monthly pivotal support holds, the Index is likely to see another round of potential upside movement to resume its multi-month bullish trend to target 30150 before 30500.
On the other hand, failure to hold above 26670 may damage the multi-month bullish trend for a deeper decline towards the long-term significant support at 25150/25000 (former resistance that capped the Index since October 2010).
StoneX Financial Ltd (trading as “City Index”) is an execution-only service provider. This material, whether or not it states any opinions, is for general information purposes only and it does not take into account your personal circumstances or objectives. This material has been prepared using the thoughts and opinions of the author and these may change. However, City Index does not plan to provide further updates to any material once published and it is not under any obligation to keep this material up to date. This material is short term in nature and may only relate to facts and circumstances existing at a specific time or day. Nothing in this material is (or should be considered to be) financial, investment, legal, tax or other advice and no reliance should be placed on it.
No opinion given in this material constitutes a recommendation by City Index or the author that any particular investment, security, transaction or investment strategy is suitable for any specific person. The material has not been prepared in accordance with legal requirements designed to promote the independence of investment research. Although City Index is not specifically prevented from dealing before providing this material, City Index does not seek to take advantage of the material prior to its dissemination. This material is not intended for distribution to, or use by, any person in any country or jurisdiction where such distribution or use would be contrary to local law or regulation.
For further details see our full non-independent research disclaimer and quarterly summary.
CFDs are complex instruments and come with a high risk of losing money rapidly due to leverage. 69% of retail investor accounts lose money when trading CFDs with this provider. You should consider whether you understand how CFDs work and whether you can afford to take the high risk of losing your money. CFD and Forex Trading are leveraged products and your capital is at risk. They may not be suitable for everyone. Please ensure you fully understand the risks involved by reading our full risk warning.
City Index is a trading name of StoneX Financial Ltd. Head and Registered Office: 1st Floor, Moor House, 120 London Wall, London, EC2Y 5ET. StoneX Financial Ltd is a company registered in England and Wales, number: 05616586. Authorised and regulated by the Financial Conduct Authority. FCA Register Number: 446717.
City Index is a trademark of StoneX Financial Ltd.
The information on this website is not targeted at the general public of any particular country. It is not intended for distribution to residents in any country where such distribution or use would contravene any local law or regulatory requirement.
© City Index 2024