RBS shares flop on very trying results
Royal Bank of Scotland’s short-lived rally on Friday speaks volumes.
Shareholder relief was evident in the immediate reaction to the group’s third-quarter numbers—Britain’s most troubled lender had, after all, emerged from the summer’s volatility in no worse shape than before, albeit no better.
The shares subsequently slipped from their initial 6% jump to fall 1.7% on the day.
RBS shareholders, who have shown the patience of saints, were acknowledging that the group’s seemingly intractable problems are barely any closer to resolution.
Some £1.194bn of value erosion easily swamped £255m of operating profit, and group return on common equity (ROE) still points to low viability, though at 4.6% the Q3 snapshot is obviously a welcome improvement on the negative trailing 12-month result at end Q2.
Nobody thinks RBS isn’t doing all the right things.
The strategy of Messrs McEwan and Stevenson looks close to optimum, and has helped the group beat adjusted operating profit expectations (£1.3bn) by some £560m.
At some difficult to define time in the future, there are good reasons to think RBS’s big push to remain UK Plc.’s biggest lender will be applauded too.
A 71% jump in adjusted income at Corporate and Investment Banking to £526m would be outstanding, if the context were more favourable.
It helped keep the attributable loss (£469m) contained well below a widely expected plunge of about £900m into the red.
And the extra wiggle room helped pump the all-important common equity tier one ratio up 50 basis points to 15%.
But it won’t mean a thing, unless RBS gets shot of Williams & Glyn.
The ‘albatross division’ ate up another £300m of cash in Q3.
Talks over a sale continue, says its owner, whilst admitting it will miss its own pushed back deadline.
By default, it’s also the EU’s deadline for a sale by the end of 2017, a condition for Europe agreeing to waive state aid rules in 2008.
Meanwhile, no sale, no dividends, according to stipulation by the government, which still owns 70%.
Shareholders also initially applauded the lack of addition to PPI provisions.
We, like others, though, are not entirely convinced that an addition hasn’t just been delayed.
We note £3.5bn of RBS’s current £4.7bn total PPI set-aside had been utilised by the end of June, whilst the FCA’s new claims deadline is June 2019.
Furthermore, the bolstering of legal provisions, and lack of insight offered into the U.S. mortgage investigation, underlines that provisioning will remain grim.
So yes, RBS is trying. The 35% fall of its stock in the year to date shows the group is successfully trying the patience of saints.
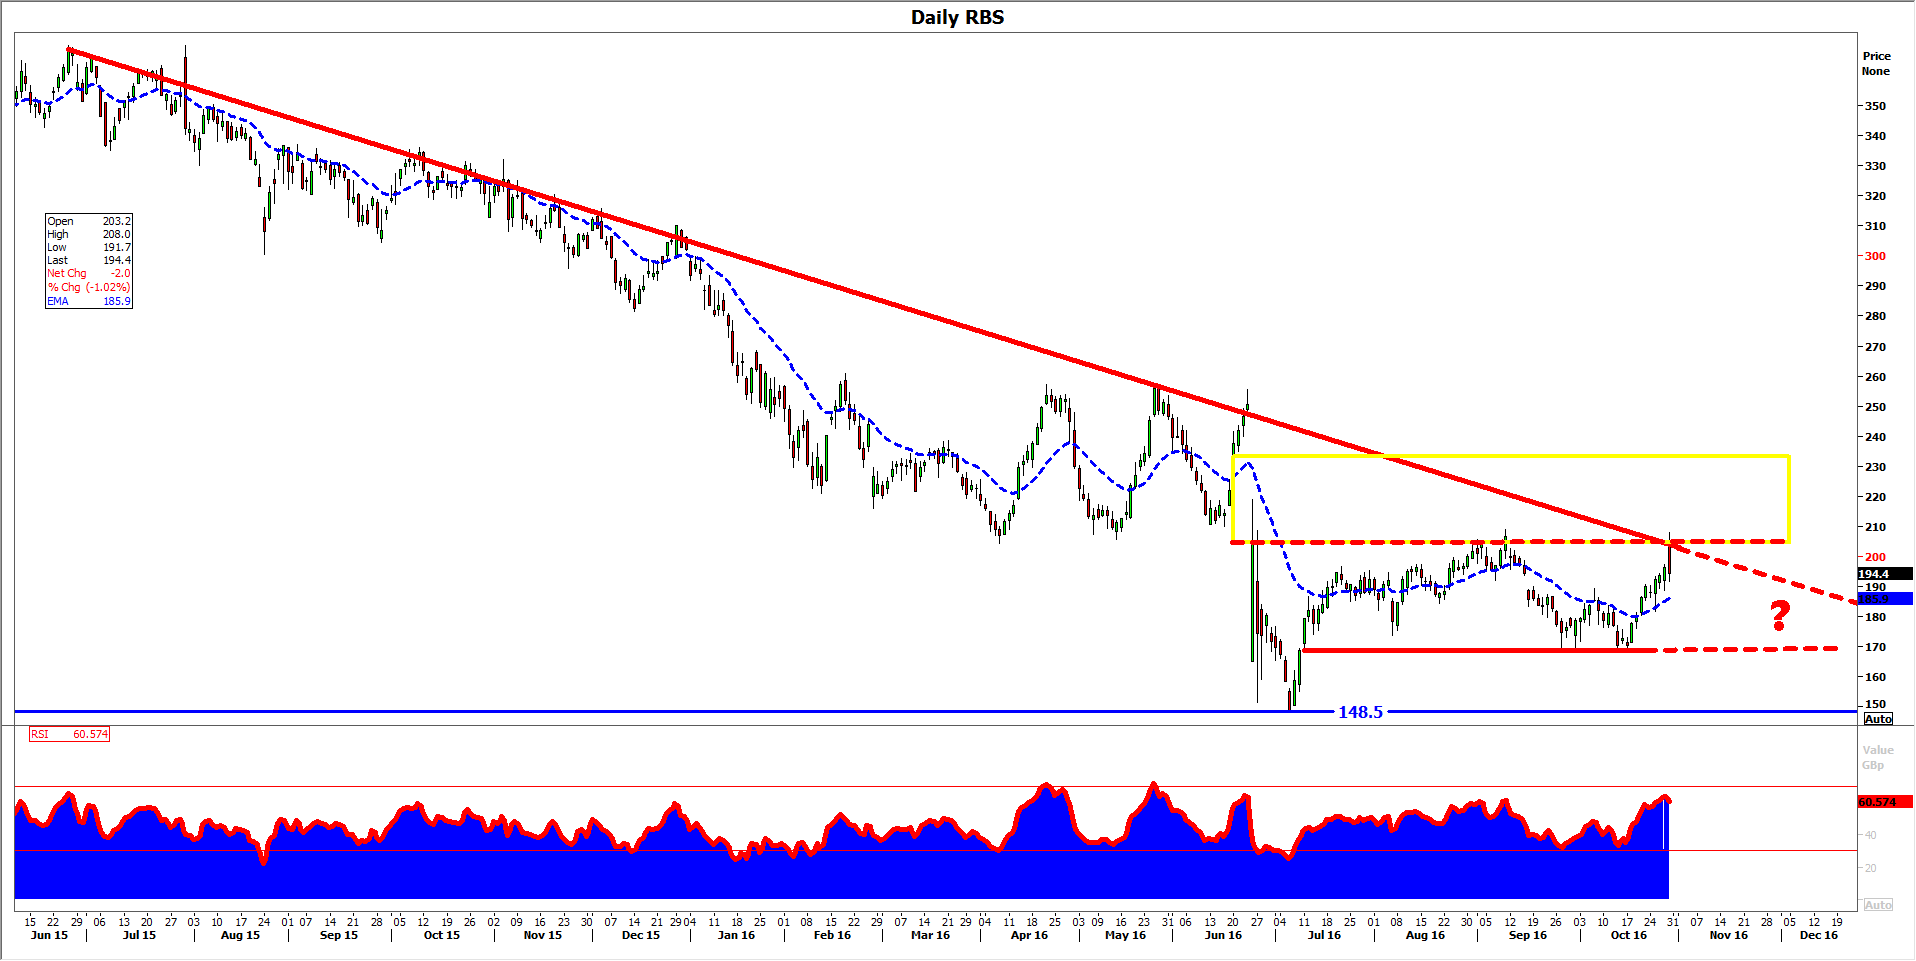
From a technical chart perspective, shareholders, have not been reassured enough for the stock to recoup all of its Brexit-vote losses.
- Both of the share’s subsequent approaches to 200p have been sold hard, including Friday’s, following Q3 figures.
- The stock looks like it is still resolving several gaps opened into the run-up and in the aftermath of the referendum.
- However, should it remain capped by both resistance mentioned above, and the effect of a falling trend in effect since June 2015, the chance of a drift back toward strong recent support around 170p will remain.
- Buyers will wish to avoid this.
- The clear descending triangle being formed would theoretically point to a surge lower that is equal to the length of the shock-induced tumble on 23rd-27th June, if 170p support breaks.
DAILY CHART
Please click image to enlarge
StoneX Financial Ltd (trading as “City Index”) is an execution-only service provider. This material, whether or not it states any opinions, is for general information purposes only and it does not take into account your personal circumstances or objectives. This material has been prepared using the thoughts and opinions of the author and these may change. However, City Index does not plan to provide further updates to any material once published and it is not under any obligation to keep this material up to date. This material is short term in nature and may only relate to facts and circumstances existing at a specific time or day. Nothing in this material is (or should be considered to be) financial, investment, legal, tax or other advice and no reliance should be placed on it.
No opinion given in this material constitutes a recommendation by City Index or the author that any particular investment, security, transaction or investment strategy is suitable for any specific person. The material has not been prepared in accordance with legal requirements designed to promote the independence of investment research. Although City Index is not specifically prevented from dealing before providing this material, City Index does not seek to take advantage of the material prior to its dissemination. This material is not intended for distribution to, or use by, any person in any country or jurisdiction where such distribution or use would be contrary to local law or regulation.
For further details see our full non-independent research disclaimer and quarterly summary.
CFDs are complex instruments and come with a high risk of losing money rapidly due to leverage. 69% of retail investor accounts lose money when trading CFDs with this provider. You should consider whether you understand how CFDs work and whether you can afford to take the high risk of losing your money. CFD and Forex Trading are leveraged products and your capital is at risk. They may not be suitable for everyone. Please ensure you fully understand the risks involved by reading our full risk warning.
City Index is a trading name of StoneX Financial Ltd. Head and Registered Office: 1st Floor, Moor House, 120 London Wall, London, EC2Y 5ET. StoneX Financial Ltd is a company registered in England and Wales, number: 05616586. Authorised and regulated by the Financial Conduct Authority. FCA Register Number: 446717.
City Index is a trademark of StoneX Financial Ltd.
The information on this website is not targeted at the general public of any particular country. It is not intended for distribution to residents in any country where such distribution or use would contravene any local law or regulatory requirement.
© City Index 2024