RBS creeps up on Barclays as worst UK bank share
RBS just rounded off a dire first quarter for UK banks with an almost £1bn loss, the worst result of the ‘Big 3′.
Lingering regulatory costs and legal entanglements continue to take their toll. These, combined with investor worries about Brexit have pushed the sector deep into the red for the year.
Barclays shares have been the worst performers in 2016, falling more than 20%, but Royal Bank of Scotland has crept lower in recent sessions, extending its 2016 loss to almost 19% at the time of writing.
The Edinburgh-based bank is likely to try investor patience further after warning on Friday that a host of major issues will linger for longer.
- It signalled that the wait before it starts paying dividends isn’t anywhere near over
- It warned of an additional £1bn in revamp charges this year
- It underlined that penalties in the US for repackaged mortgage loan mis-selling are likely to be heavy
The group also missed expectations for its capital buffer: that came in at 14.6% compared to 15.6% expected by analysts, though above the 11.5% reported for Q1 2015; whilst its £968m loss was above the average £957m analyst forecast compiled by RBS itself.
Many investors may decide enough is enough. For instance, US brokerage Bernstein told clients this morning RBS’s admission on Thursday that it wouldn’t meet a deadline for selling its William’s & Glyn branches was the final straw. “With the excess capital now being tied to … the W&G surgery where we have no option but to trust management’s view on complications, we have decided to get out”, said Bernstein.
We think they’ll have company.
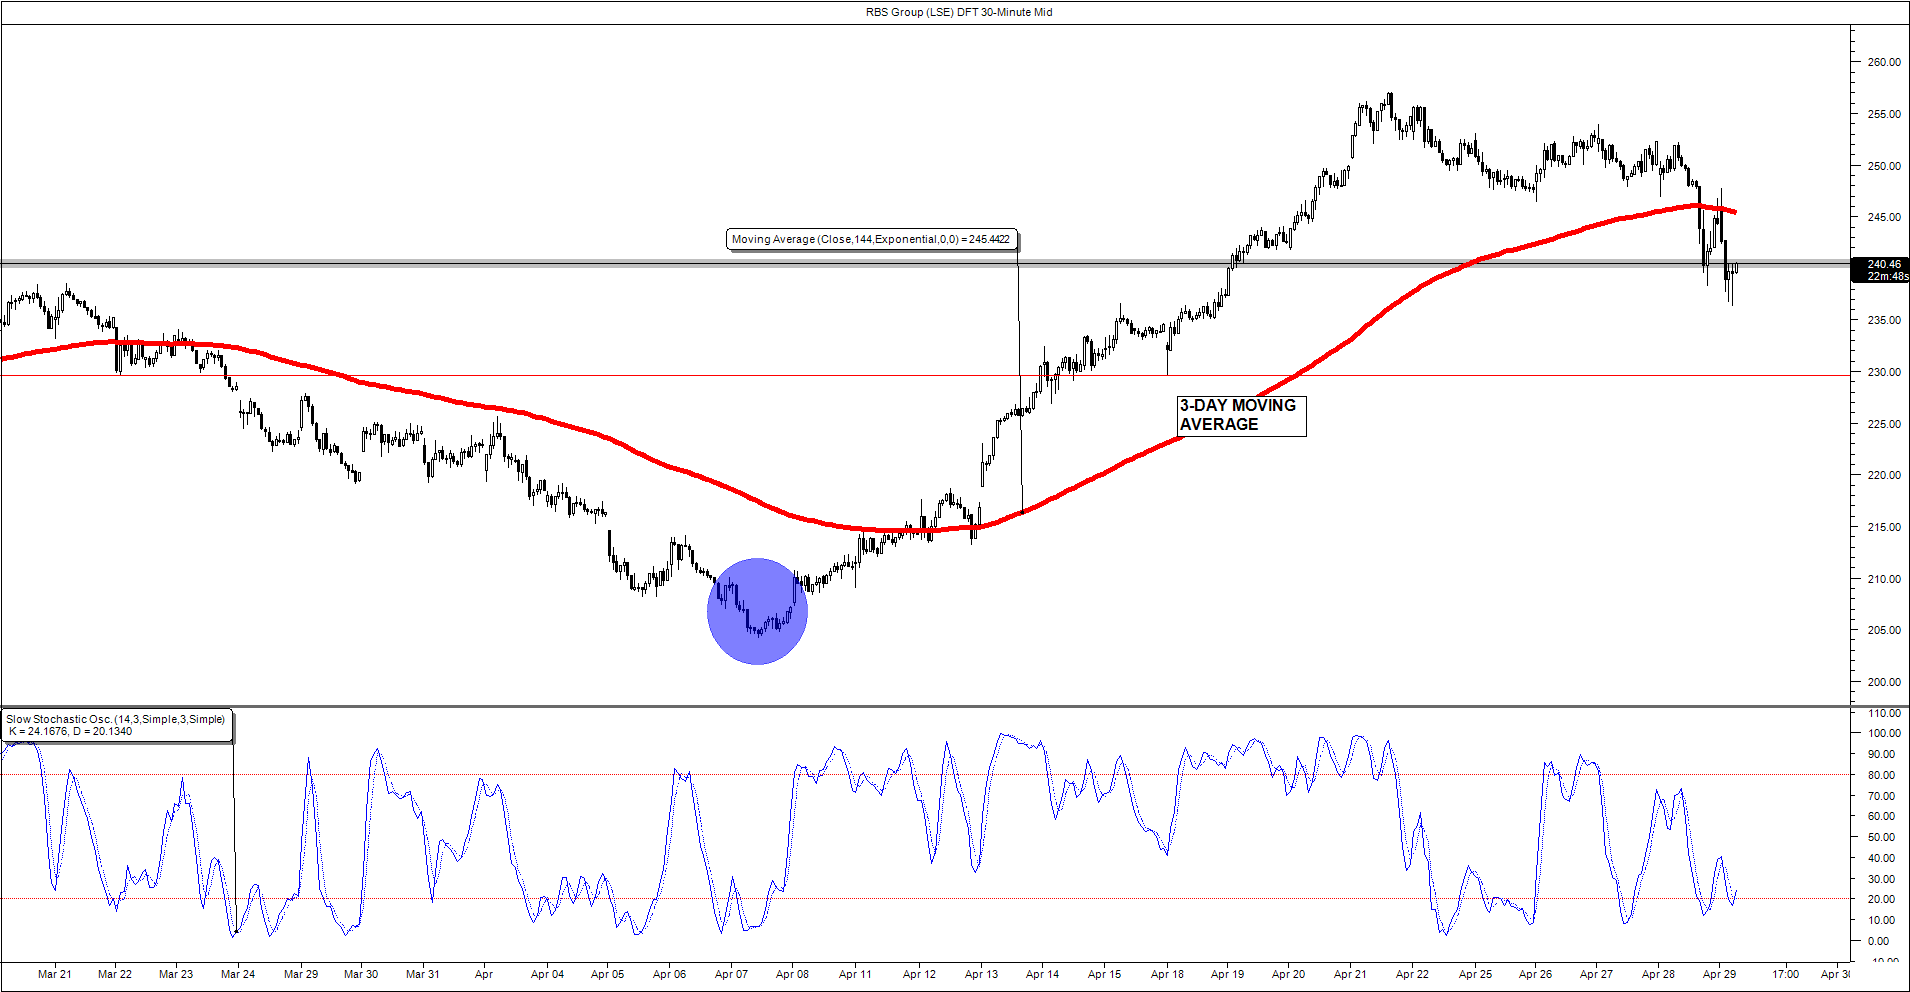
From a short-term technical perspective, the slump of RBS shares below the 3-day moving average (MA in red in our chart below) corroborates the view that the stock’s weak phase has been exacerbated.
Note: three days is equal to 144 half-hour periods as stated within the chart.
The stock traded 2.2% lower at the time of writing, approaching 230p, a ‘psychological’ level for investors, at which the price bounced earlier this month.
Should current selling break through 230p in the near term, the chance of a return to RBS’s lows for the year, seen earlier this month around 204p, would increase.
The stock cannot be said to have regained poise before getting back above the MA mentioned above.
HALF-HOURLY CHART: RBS DAILY FUNDED TRADE
Please click image to enlarge
StoneX Financial Ltd (trading as “City Index”) is an execution-only service provider. This material, whether or not it states any opinions, is for general information purposes only and it does not take into account your personal circumstances or objectives. This material has been prepared using the thoughts and opinions of the author and these may change. However, City Index does not plan to provide further updates to any material once published and it is not under any obligation to keep this material up to date. This material is short term in nature and may only relate to facts and circumstances existing at a specific time or day. Nothing in this material is (or should be considered to be) financial, investment, legal, tax or other advice and no reliance should be placed on it.
No opinion given in this material constitutes a recommendation by City Index or the author that any particular investment, security, transaction or investment strategy is suitable for any specific person. The material has not been prepared in accordance with legal requirements designed to promote the independence of investment research. Although City Index is not specifically prevented from dealing before providing this material, City Index does not seek to take advantage of the material prior to its dissemination. This material is not intended for distribution to, or use by, any person in any country or jurisdiction where such distribution or use would be contrary to local law or regulation.
For further details see our full non-independent research disclaimer and quarterly summary.
CFDs are complex instruments and come with a high risk of losing money rapidly due to leverage. 69% of retail investor accounts lose money when trading CFDs with this provider. You should consider whether you understand how CFDs work and whether you can afford to take the high risk of losing your money. CFD and Forex Trading are leveraged products and your capital is at risk. They may not be suitable for everyone. Please ensure you fully understand the risks involved by reading our full risk warning.
City Index is a trading name of StoneX Financial Ltd. Head and Registered Office: 1st Floor, Moor House, 120 London Wall, London, EC2Y 5ET. StoneX Financial Ltd is a company registered in England and Wales, number: 05616586. Authorised and regulated by the Financial Conduct Authority. FCA Register Number: 446717.
City Index is a trademark of StoneX Financial Ltd.
The information on this website is not targeted at the general public of any particular country. It is not intended for distribution to residents in any country where such distribution or use would contravene any local law or regulatory requirement.
© City Index 2024