Randgold shares supported after blistering quarter
Randgold’s blistering quarter delivers on the mooted annual dividend rise (+52%) in line with net cash coming in a little above target after a sure-footed 72% surge in Q4.
That explains the stock price improvement to a three-month high on Monday, though judging by the share’s elasticity around its highest levels today, investors also have a moderate balance of wariness too.
We’re watching the recent moderation of the gold price recovery, the impact on taxation from conclusion of an exoneration period in Mali at end-2015 and persistent production missteps, albeit these had a relatively narrow scope in the fourth quarter.
Randgold has modelled for gold at $1,000; whilst investment case obviously makes more sense with current prices above $1200 and the spot’s end 2015-July 2016 advance is over, leaving it 10.5% lower since July.
We also note lower production Massawa-Sofia development project sensitivity equates to a 45% change in revenues at $1,000/Oz from a 5% change in the gold price compared to c.26% sensitivity at the Gounkoto super pit.
Meanwhile, in Mali, Morila actually made a $7.1m loss. That was partly due to an unexpected production decline from lower-grade tailings, rising depreciation and project costs from Randgold’s planned agribusiness.
The Malian loss is a reminder that Randgold’s leeway in its complex operating environments remains malleable from multiple external factors. At least the impact of the 5 day sit-in at Tongon should be negligible. But it is the occurrence of the industrial action at all that investors will keep an eye on. The group itself suggested last week that workers may have been emboldened by industrial action elsewhere in the region.
Taxation, production, and industrial questions are the main risks we see to the group’s nascent recovery. More to the point, they’ll go a long way to deciding when the next significant dividend hike may be seen.
Like many London-listed gold mining shares, Randgold shares enjoyed a strong advance between late 2015 and the summer of 2016 in step with the recovery of most metals prices and certainly that of gold. However, as noted, gold has relapsed, and Randgold is tracking the fall to a degree. That adds to an air of modesty surrounding the stock’s price momentum and valuation as a whole.
Randgold’s was actually one of the least exuberant rises among peers in 2016 at 54%, compared to Anglo’s c.290% surge. And relative to FTSE 350 miners, the stock actually fell 46.7%. With EPS growth looking like the best in class so far in the reporting season, Randgold’s 27 times price/earnings is only just beginning to look punchy.
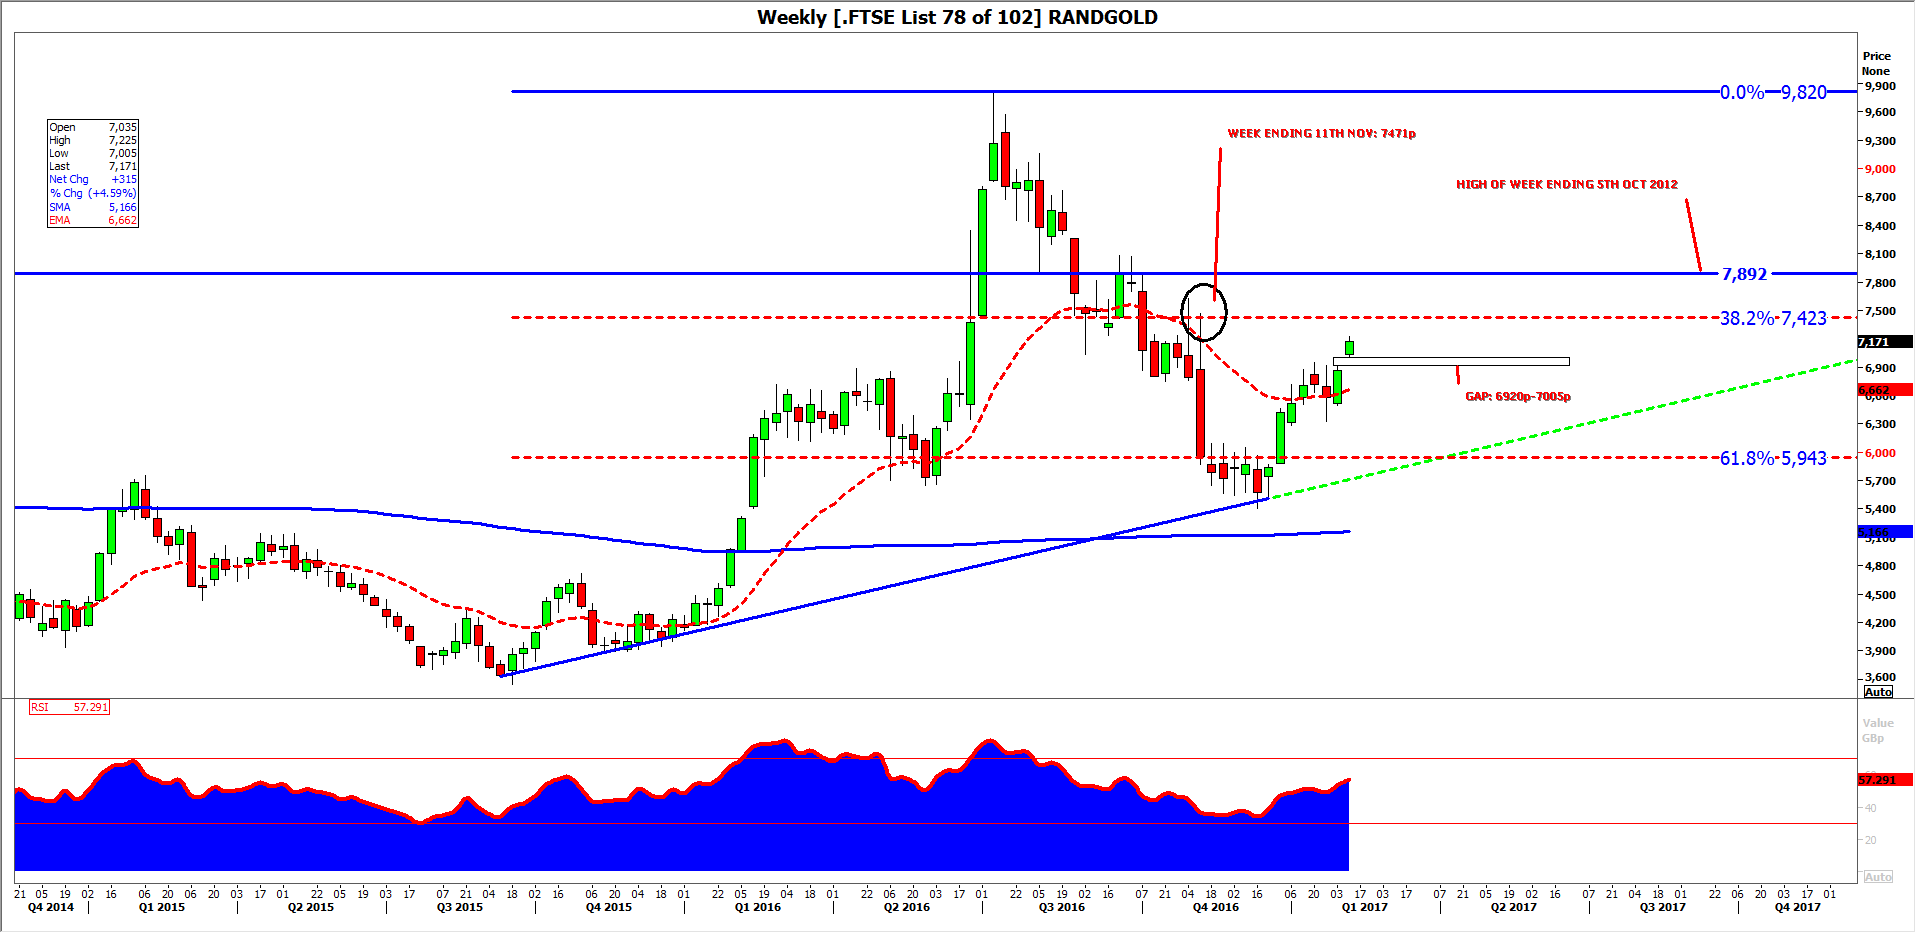
The stock began to retrace at 61.8% of the September 2015-July 2016 move, pointing to continued orderliness in the market structure, reducing the chance of really nasty surprises, despite the share’s high beta. Room towards a retest of the highs in early November is highly probable, even if an 85 pence gap that opened on Monday will very likely be filled this week.
Whether or not the stock can surpass those November highs (the stock touched 7471 pence early in November) is another matter. For those with a longer-term view though, Randgold continues to look supported.
RANDGOLD RESOURCES WEEKLY POST Q4 EARNINGS
Source: Thomson Reuters; please click image to enlarge
StoneX Financial Ltd (trading as “City Index”) is an execution-only service provider. This material, whether or not it states any opinions, is for general information purposes only and it does not take into account your personal circumstances or objectives. This material has been prepared using the thoughts and opinions of the author and these may change. However, City Index does not plan to provide further updates to any material once published and it is not under any obligation to keep this material up to date. This material is short term in nature and may only relate to facts and circumstances existing at a specific time or day. Nothing in this material is (or should be considered to be) financial, investment, legal, tax or other advice and no reliance should be placed on it.
No opinion given in this material constitutes a recommendation by City Index or the author that any particular investment, security, transaction or investment strategy is suitable for any specific person. The material has not been prepared in accordance with legal requirements designed to promote the independence of investment research. Although City Index is not specifically prevented from dealing before providing this material, City Index does not seek to take advantage of the material prior to its dissemination. This material is not intended for distribution to, or use by, any person in any country or jurisdiction where such distribution or use would be contrary to local law or regulation.
For further details see our full non-independent research disclaimer and quarterly summary.
CFDs are complex instruments and come with a high risk of losing money rapidly due to leverage. 69% of retail investor accounts lose money when trading CFDs with this provider. You should consider whether you understand how CFDs work and whether you can afford to take the high risk of losing your money. CFD and Forex Trading are leveraged products and your capital is at risk. They may not be suitable for everyone. Please ensure you fully understand the risks involved by reading our full risk warning.
City Index is a trading name of StoneX Financial Ltd. Head and Registered Office: 1st Floor, Moor House, 120 London Wall, London, EC2Y 5ET. StoneX Financial Ltd is a company registered in England and Wales, number: 05616586. Authorised and regulated by the Financial Conduct Authority. FCA Register Number: 446717.
City Index is a trademark of StoneX Financial Ltd.
The information on this website is not targeted at the general public of any particular country. It is not intended for distribution to residents in any country where such distribution or use would contravene any local law or regulatory requirement.
© City Index 2024