Putin inspired crude oil rally boosts Canadian dollar
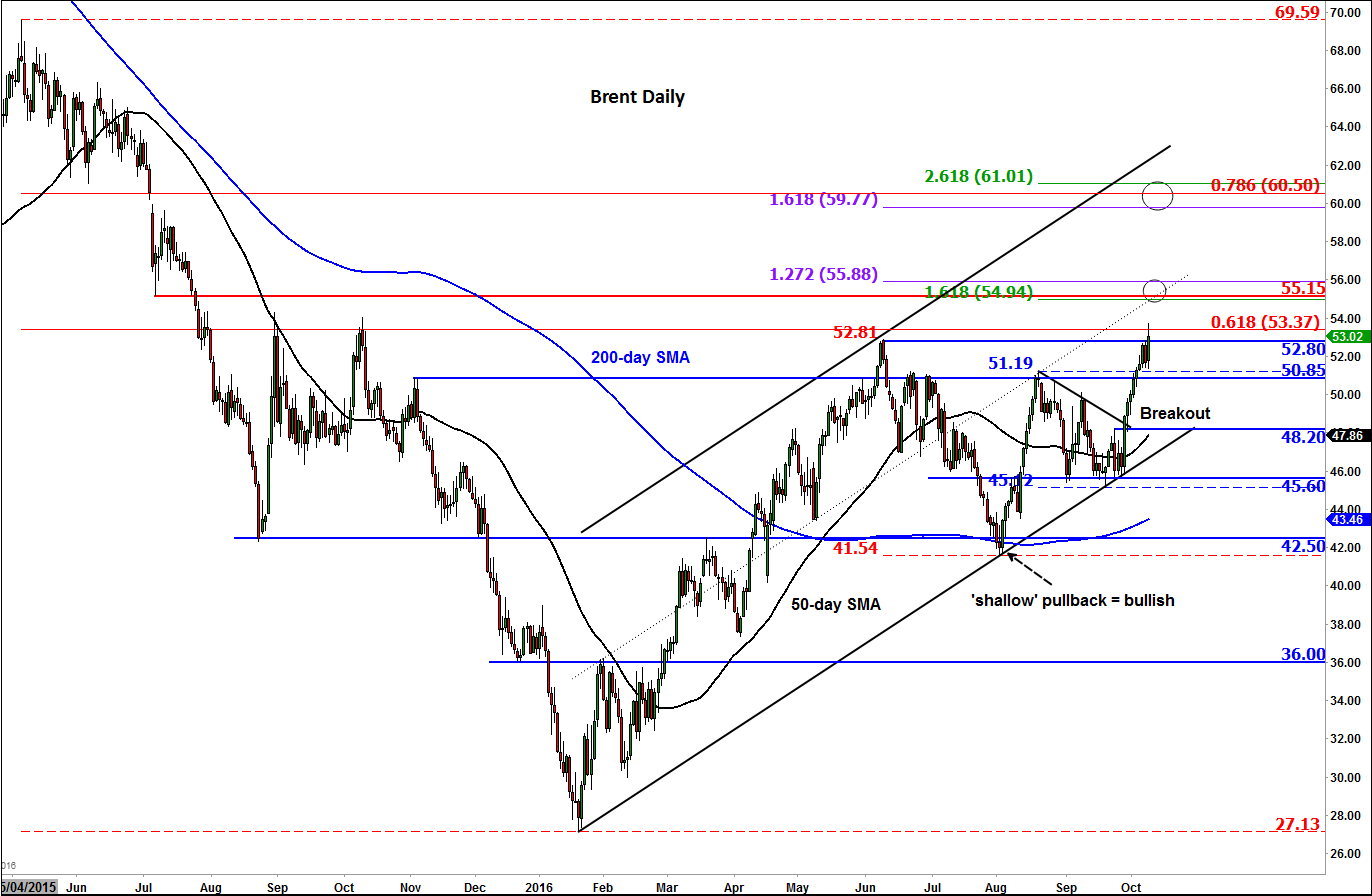
Crude oil prices surged higher in response to comments made by Russian President Vladimir Putin about a Russian-OPEC production cut. Brent oil reached a new 52-week high around $53.70 per barrel (see figure 1) while WTI came to within a few cents of the $51.65 level it had hit in June. As Canada is a major oil producing nation, the bullish response from the Canadian dollar was hardly surprising: the USD/CAD dropped below 1.32 again and other CAD crosses rose sharply too, especially against currencies where the central bank is still uber-dovish, such as the yen.
Putin’s comments have taken the market by a bit of a surprise. I think the OPEC and Russia have recognised that sentiment on the oil market is turning bullish and they want to keep that momentum going by committing to what the market is demanding: production cuts. Major oil producing nations like Russia know how punishing the markets can be, so they may well succumb to pressure and actually reduce supply this time around because failure to do so would be disastrous. They have talked the talk, now it is time to walk the walk if they are committed to keeping oil prices north of $50 a barrel.
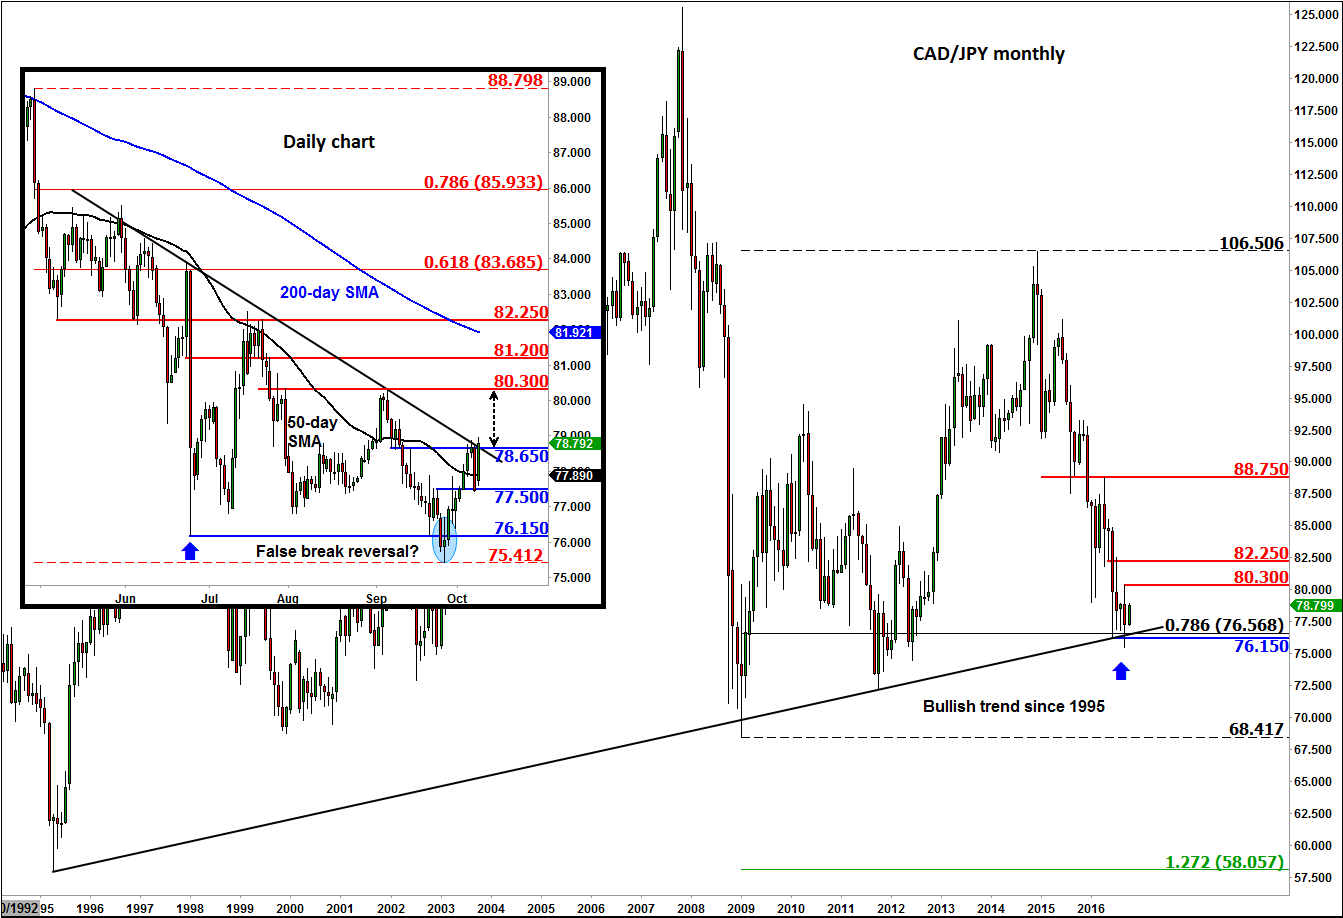
Technical outlook: CAD/JPY
From a technical point of view the CAD/JPY cross is beginning to look quite bullish on all time frames. On the monthly chart, in figure 2, the CAD/JPY has once again held its own above a rising trend line that stretches back to 1995. It has also defended its long-term 78.6% Fibonacci retracement level at around 75.55.
What’s more, the cross may have formed a key reversal pattern on its short-term charts around the June 2016 low of 76.15 (see the daily chart in the inset, in figure 2). After creating that low, the CAD/JPY had one more attempt to break further lower at the end of September. Although it traded below this level for a while, there was no significant follow-though in the selling pressure. As a result, a false breakout pattern may have been created there. Subsequently, the CAD/JPY has bounced back due to a combination of profit-taking from the sellers and opportunistic buying from those who quickly realised that the balance of power was shifting away from the bears.
More gains could be on the way for the CAD/JPY if it now manages to break above its descending trend line around the 78.65/80 area on a daily closing basis. If successful, we could see a rally towards the next swing high at 80.30. Further near-term potential bullish targets are around 81.20 and 82.25, levels that were previously support and/or resistance.
However, if support at 77.50 gives way then there is scope for the CAD/JPY to go for another test of that 76.15 handle. Ultimately though, oil prices will have a big say in the direction of the CAD/JPY and CAD crosses in general.
StoneX Financial Ltd (trading as “City Index”) is an execution-only service provider. This material, whether or not it states any opinions, is for general information purposes only and it does not take into account your personal circumstances or objectives. This material has been prepared using the thoughts and opinions of the author and these may change. However, City Index does not plan to provide further updates to any material once published and it is not under any obligation to keep this material up to date. This material is short term in nature and may only relate to facts and circumstances existing at a specific time or day. Nothing in this material is (or should be considered to be) financial, investment, legal, tax or other advice and no reliance should be placed on it.
No opinion given in this material constitutes a recommendation by City Index or the author that any particular investment, security, transaction or investment strategy is suitable for any specific person. The material has not been prepared in accordance with legal requirements designed to promote the independence of investment research. Although City Index is not specifically prevented from dealing before providing this material, City Index does not seek to take advantage of the material prior to its dissemination. This material is not intended for distribution to, or use by, any person in any country or jurisdiction where such distribution or use would be contrary to local law or regulation.
For further details see our full non-independent research disclaimer and quarterly summary.
CFDs are complex instruments and come with a high risk of losing money rapidly due to leverage. 69% of retail investor accounts lose money when trading CFDs with this provider. You should consider whether you understand how CFDs work and whether you can afford to take the high risk of losing your money. CFD and Forex Trading are leveraged products and your capital is at risk. They may not be suitable for everyone. Please ensure you fully understand the risks involved by reading our full risk warning.
City Index is a trading name of StoneX Financial Ltd. Head and Registered Office: 1st Floor, Moor House, 120 London Wall, London, EC2Y 5ET. StoneX Financial Ltd is a company registered in England and Wales, number: 05616586. Authorised and regulated by the Financial Conduct Authority. FCA Register Number: 446717.
City Index is a trademark of StoneX Financial Ltd.
The information on this website is not targeted at the general public of any particular country. It is not intended for distribution to residents in any country where such distribution or use would contravene any local law or regulatory requirement.
© City Index 2024