Pressured US stocks dangle off a head and shoulders cliff
Wednesday’s hawkish FOMC minutes increased speculation that a June interest rate hike by the Federal Reserve may be more likely than previously anticipated. These higher expectations have helped prompt a boost for the US dollar, a plunge in gold prices, and pressure on US and global stock markets. Additionally, a pullback in crude oil prices on a stronger dollar and abating oil supply disruptions has led to a drop in the energy sector, which has also weighed on equities.
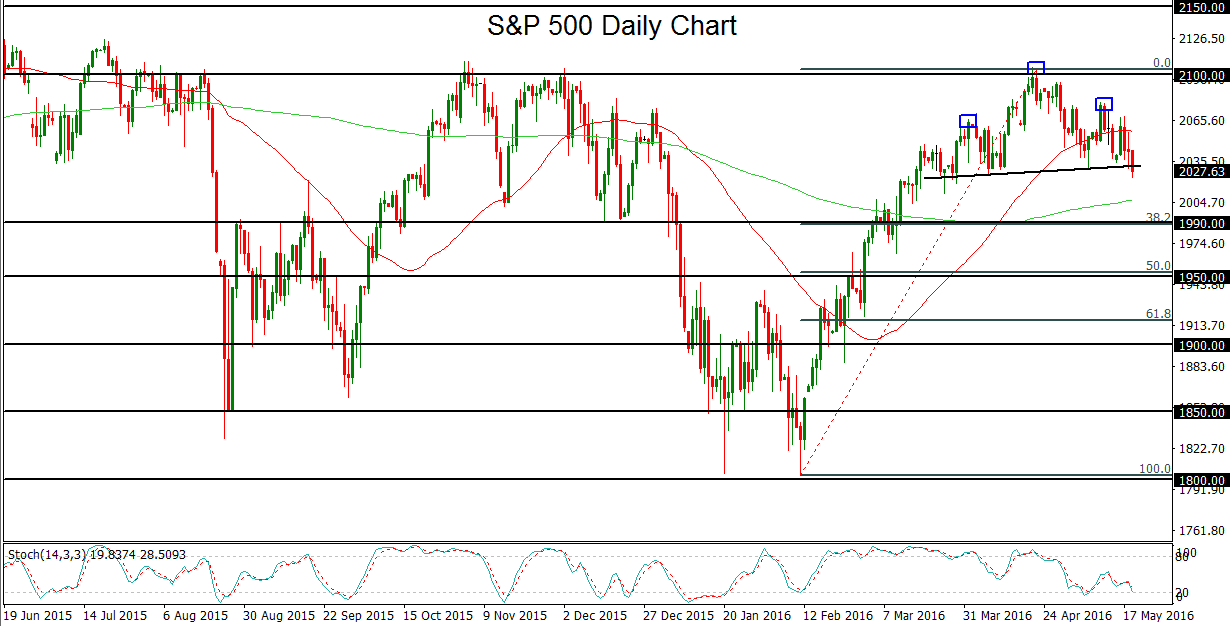
In the midst of this pressure on the stock market, the S&P 500 index has formed a rough head-and-shoulder formation, which is often regarded as a potential bearish reversal pattern. As of Thursday, the index has tentatively broken below the pattern, but has not yet confirmed this breakdown.
This key technical pattern has formed after the S&P 500 rose in a sharp uptrend from its mid-February low around 1800 to its late-April high around 2100. Since early April, however, the index has been trading in a consolidation within the head-and-shoulder pattern, establishing the head around the noted 2100-area high in late April. Within the course of the month-long fall from that high, the 50-day moving average has begun to rollover towards the downside, indicating a potential loss of upside momentum.
A strong close below the head-and-shoulders neckline, currently around the 2030 level, could prompt a further drop towards the next major support target to the downside at the 1990 level, which also happens to be the 38% Fibonacci retracement of the noted uptrend from February’s 1800-area low up to April’s 2100-area high. Further to the downside, the actual measured target of the head-and-shoulders pattern is currently around the 1950 level, which is also the 50% retracement of the same recent uptrend.
StoneX Financial Ltd (trading as “City Index”) is an execution-only service provider. This material, whether or not it states any opinions, is for general information purposes only and it does not take into account your personal circumstances or objectives. This material has been prepared using the thoughts and opinions of the author and these may change. However, City Index does not plan to provide further updates to any material once published and it is not under any obligation to keep this material up to date. This material is short term in nature and may only relate to facts and circumstances existing at a specific time or day. Nothing in this material is (or should be considered to be) financial, investment, legal, tax or other advice and no reliance should be placed on it.
No opinion given in this material constitutes a recommendation by City Index or the author that any particular investment, security, transaction or investment strategy is suitable for any specific person. The material has not been prepared in accordance with legal requirements designed to promote the independence of investment research. Although City Index is not specifically prevented from dealing before providing this material, City Index does not seek to take advantage of the material prior to its dissemination. This material is not intended for distribution to, or use by, any person in any country or jurisdiction where such distribution or use would be contrary to local law or regulation.
For further details see our full non-independent research disclaimer and quarterly summary.
CFDs are complex instruments and come with a high risk of losing money rapidly due to leverage. 69% of retail investor accounts lose money when trading CFDs with this provider. You should consider whether you understand how CFDs work and whether you can afford to take the high risk of losing your money. CFD and Forex Trading are leveraged products and your capital is at risk. They may not be suitable for everyone. Please ensure you fully understand the risks involved by reading our full risk warning.
City Index is a trading name of StoneX Financial Ltd. Head and Registered Office: 1st Floor, Moor House, 120 London Wall, London, EC2Y 5ET. StoneX Financial Ltd is a company registered in England and Wales, number: 05616586. Authorised and regulated by the Financial Conduct Authority. FCA Register Number: 446717.
City Index is a trademark of StoneX Financial Ltd.
The information on this website is not targeted at the general public of any particular country. It is not intended for distribution to residents in any country where such distribution or use would contravene any local law or regulatory requirement.
© City Index 2024