Precarious situation now for Starbucks bulls in the medium term
Medium-term technical outlook on Starbucks Corp (SBUX)
click to enlarge charts
Key Levels (1 to 3 weeks)
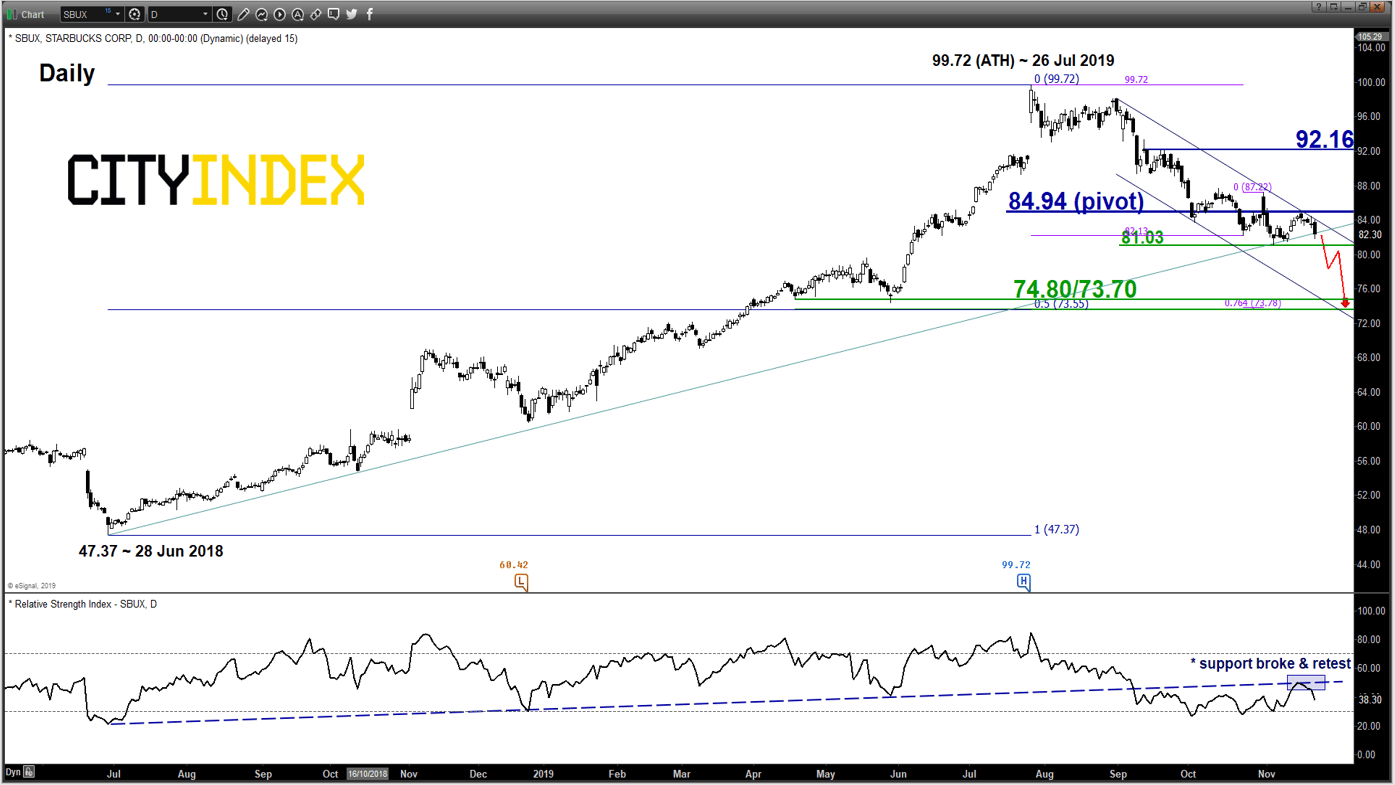
Pivot (key resistance): 84.94
Supports: 81.03 (trigger) & 74.80/73.70
Next resistance: 92.16
Directional Bias (1 to 3 weeks)
Bearish bias below 84.94 key medium-term pivotal resistance and a break below 81.03 reinforces the start of a multi-week corrective down move sequence to target the 74.80/73.70 support zone in the first step.
On the flipside, a clearance with a daily close above 84.94 negates the bearish tone for a rebound towards the next resistance at 92.16 (12 Sep 2019 swing high & 61.8% Fibonacci retracement of the on-going decline from 26 Jul high to 05 Nov 2019 low).
Key elements
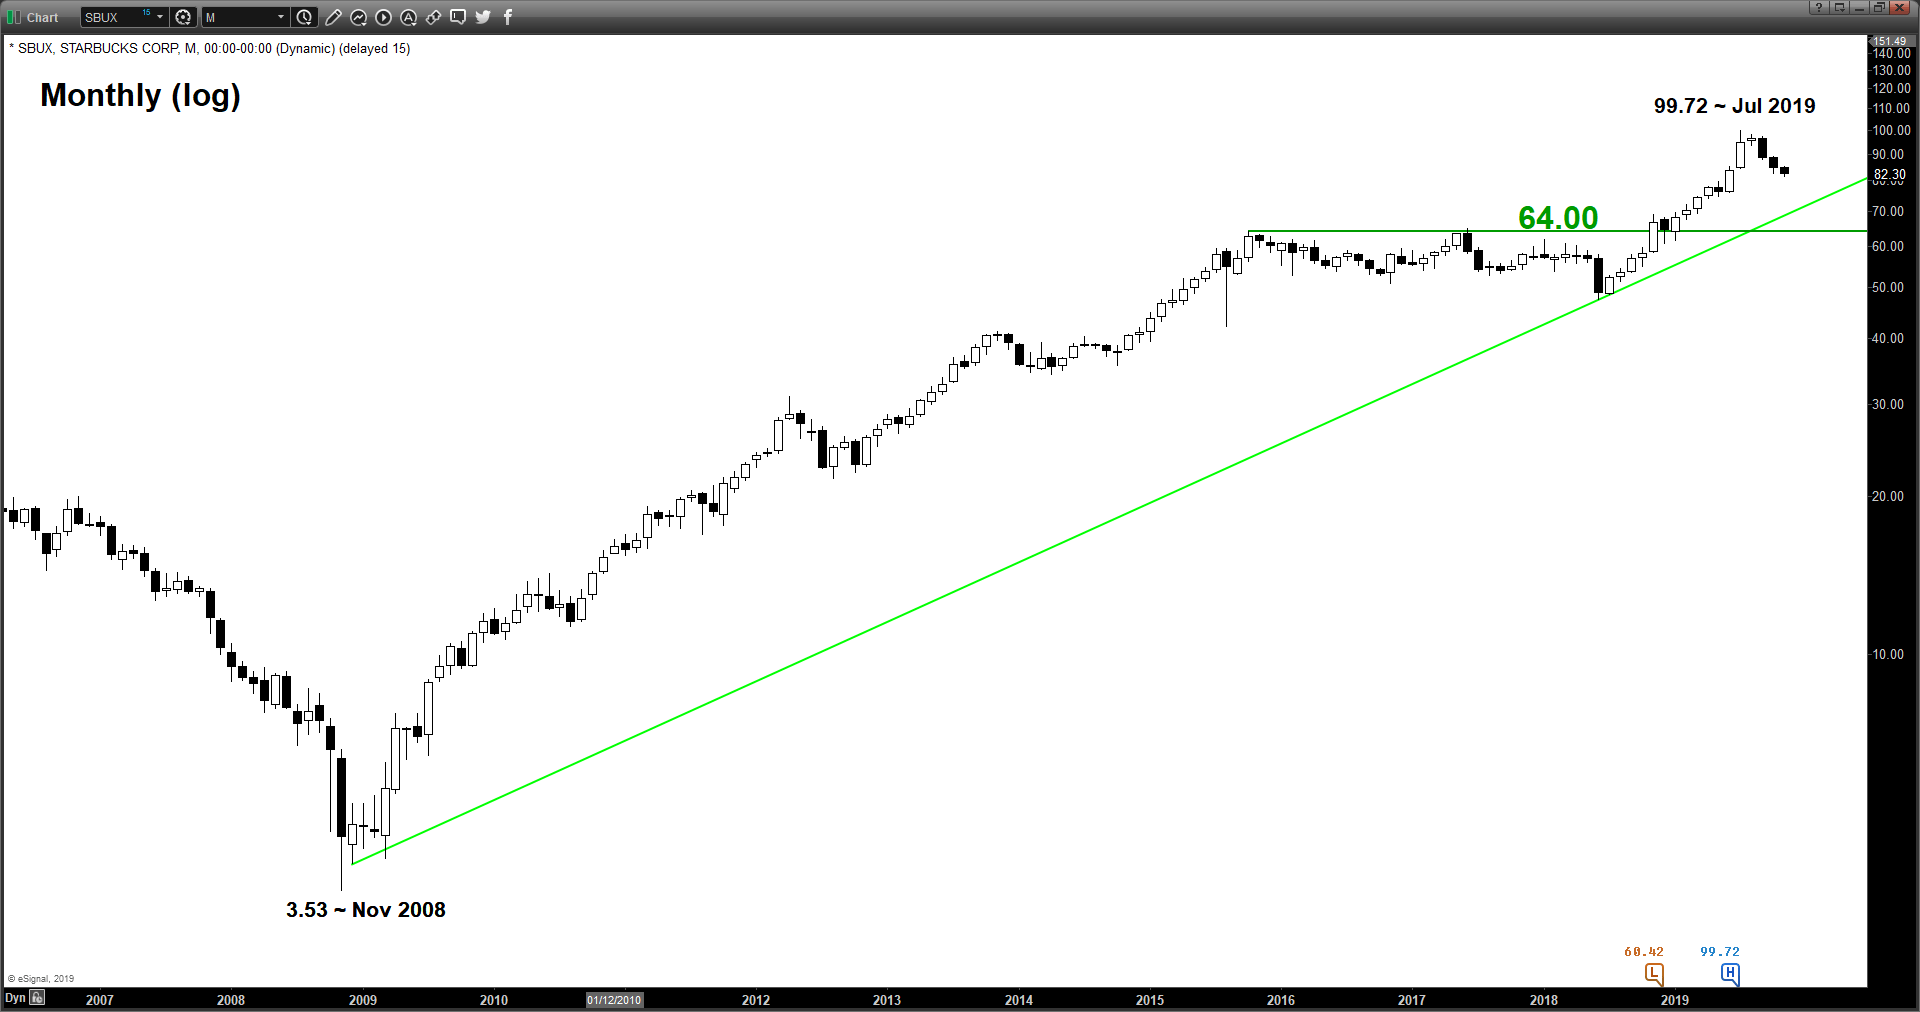
- Since its all-time of 99.73 printed on 26 Jul 2019, the share price of SBUX has declined by 18% so far and it is now testing a major ascending trendline support in place since 28 Jun 2018 low.
- Also, it has traced out a series of “lower highs and lower lows” since 26 Jul 2019 that indicates the major uptrend phase from 28 Jun 2018 is at risk of transiting to a corrective down move phase.
- The daily RSI oscillator has already staged a bearish breakdown from a significant support (in parallel with the price action support from 28 Jun 2018 low) and retreated from it on 18 Nov 2019. These observations suggest that medium-term downside momentum remains intact and the major uptrend phase of SBUX since 28 Jun 2018 is at risk of being damaged.
- The 74.80/73.70 support zone is defined by a confluence of elements; the swing low areas of 17 Apr/29 May 2019, the lower boundary of a medium-term descending channel from 30 Aug 2019 high & a Fibonacci retracement/expansion cluster).
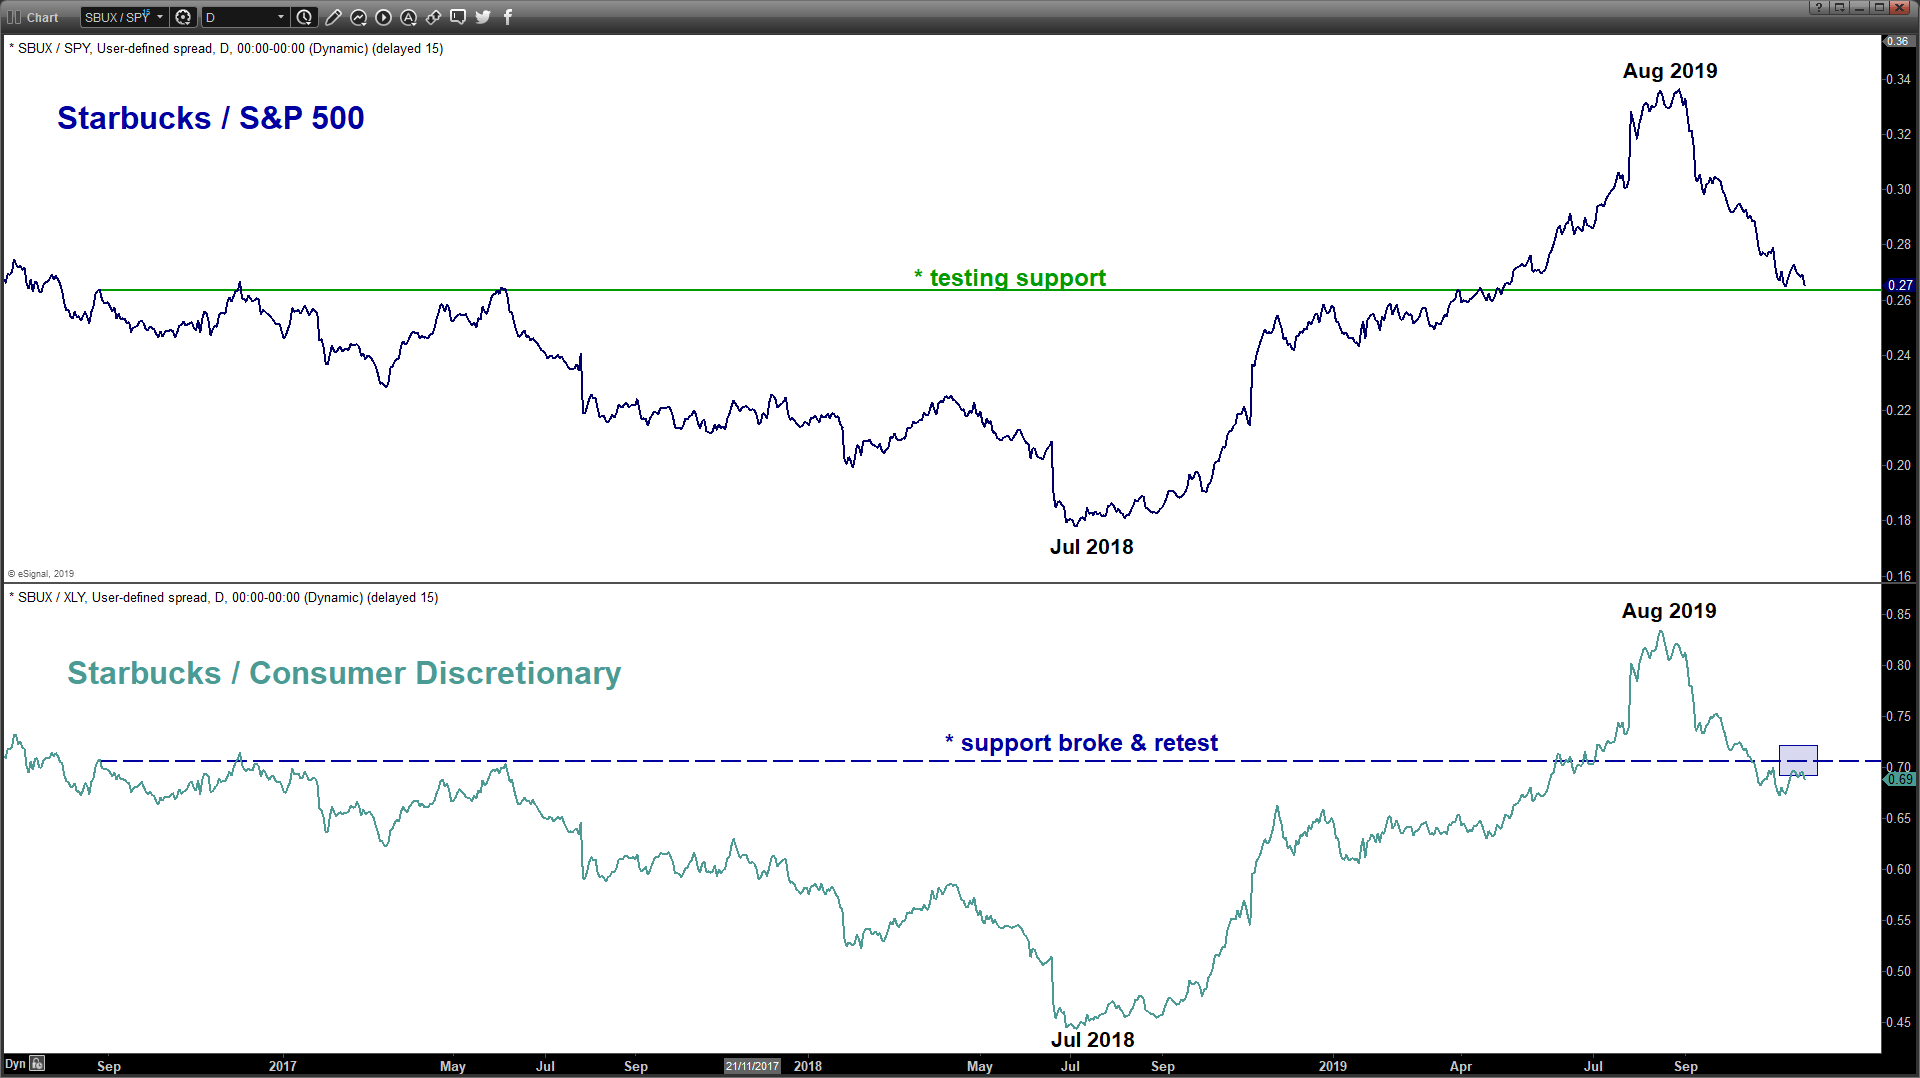
- Relative strength analysis from its ratio charts against the market (S&P 500) and its sector (Consumer Discretionary) suggest underperformance of Starbucks (SBUX).
Charts are from eSignal
StoneX Financial Ltd (trading as “City Index”) is an execution-only service provider. This material, whether or not it states any opinions, is for general information purposes only and it does not take into account your personal circumstances or objectives. This material has been prepared using the thoughts and opinions of the author and these may change. However, City Index does not plan to provide further updates to any material once published and it is not under any obligation to keep this material up to date. This material is short term in nature and may only relate to facts and circumstances existing at a specific time or day. Nothing in this material is (or should be considered to be) financial, investment, legal, tax or other advice and no reliance should be placed on it.
No opinion given in this material constitutes a recommendation by City Index or the author that any particular investment, security, transaction or investment strategy is suitable for any specific person. The material has not been prepared in accordance with legal requirements designed to promote the independence of investment research. Although City Index is not specifically prevented from dealing before providing this material, City Index does not seek to take advantage of the material prior to its dissemination. This material is not intended for distribution to, or use by, any person in any country or jurisdiction where such distribution or use would be contrary to local law or regulation.
For further details see our full non-independent research disclaimer and quarterly summary.
CFDs are complex instruments and come with a high risk of losing money rapidly due to leverage. 69% of retail investor accounts lose money when trading CFDs with this provider. You should consider whether you understand how CFDs work and whether you can afford to take the high risk of losing your money. CFD and Forex Trading are leveraged products and your capital is at risk. They may not be suitable for everyone. Please ensure you fully understand the risks involved by reading our full risk warning.
City Index is a trading name of StoneX Financial Ltd. Head and Registered Office: 1st Floor, Moor House, 120 London Wall, London, EC2Y 5ET. StoneX Financial Ltd is a company registered in England and Wales, number: 05616586. Authorised and regulated by the Financial Conduct Authority. FCA Register Number: 446717.
City Index is a trademark of StoneX Financial Ltd.
The information on this website is not targeted at the general public of any particular country. It is not intended for distribution to residents in any country where such distribution or use would contravene any local law or regulatory requirement.
© City Index 2024