Overstretched GBPJPY rally set for a multi week corrective decline over Brexit limbo
Medium-term technical outlook on GBP/JPY
click to enlarge charts
Key Levels (1 to 3 weeks)
Intermediate resistance: 140.45
Pivot (key resistance): 141.40
Supports: 135.40 & 134.00/133.55
Next resistance: 143.20/70
Directional Bias (1 to 3 weeks)
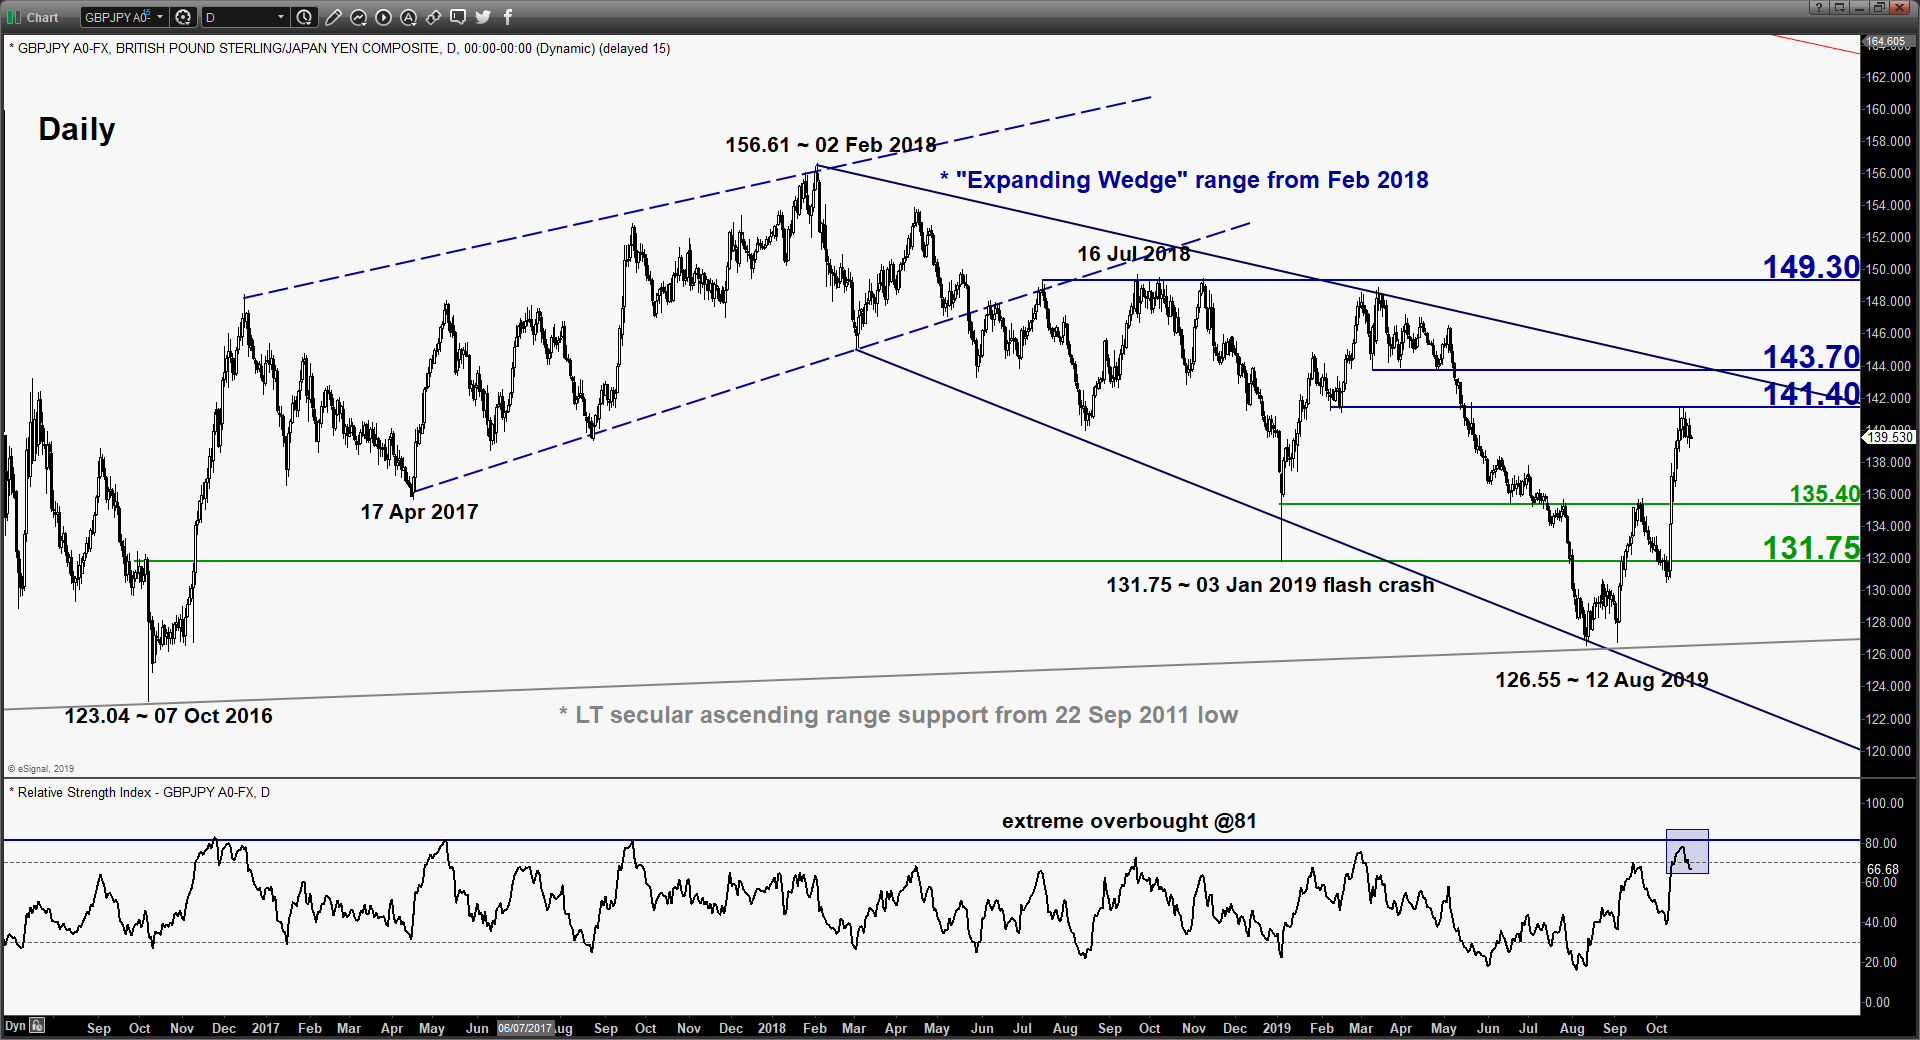
The recent 11 big figure rally from 130.40 low from 08 Oct to 141.50 high printed on 17 Oct 2019 is now at risk of shaping a multi-week corrective decline to retrace a portion of the up move from 12 Aug 2019 low to 21 Oct 2019 high.
Bearish bias below 141.40 pivotal resistance for a potential decline to target the next medium-term supports at 135.40 follow by 134.00/133.55 next before another potential multi-week upleg sequence materialises to test the upper boundary of the major “Expanding Wedge” range configuration in place since Feb 2018 high.
On the other hand, a clearance above 141.40 sees a further sequence up towards the 143.20/70 (1.382 Fibonacci expansion of the up move from 12 Aug 2019 low & major “Expanding Wedge” resistance).
Key elements
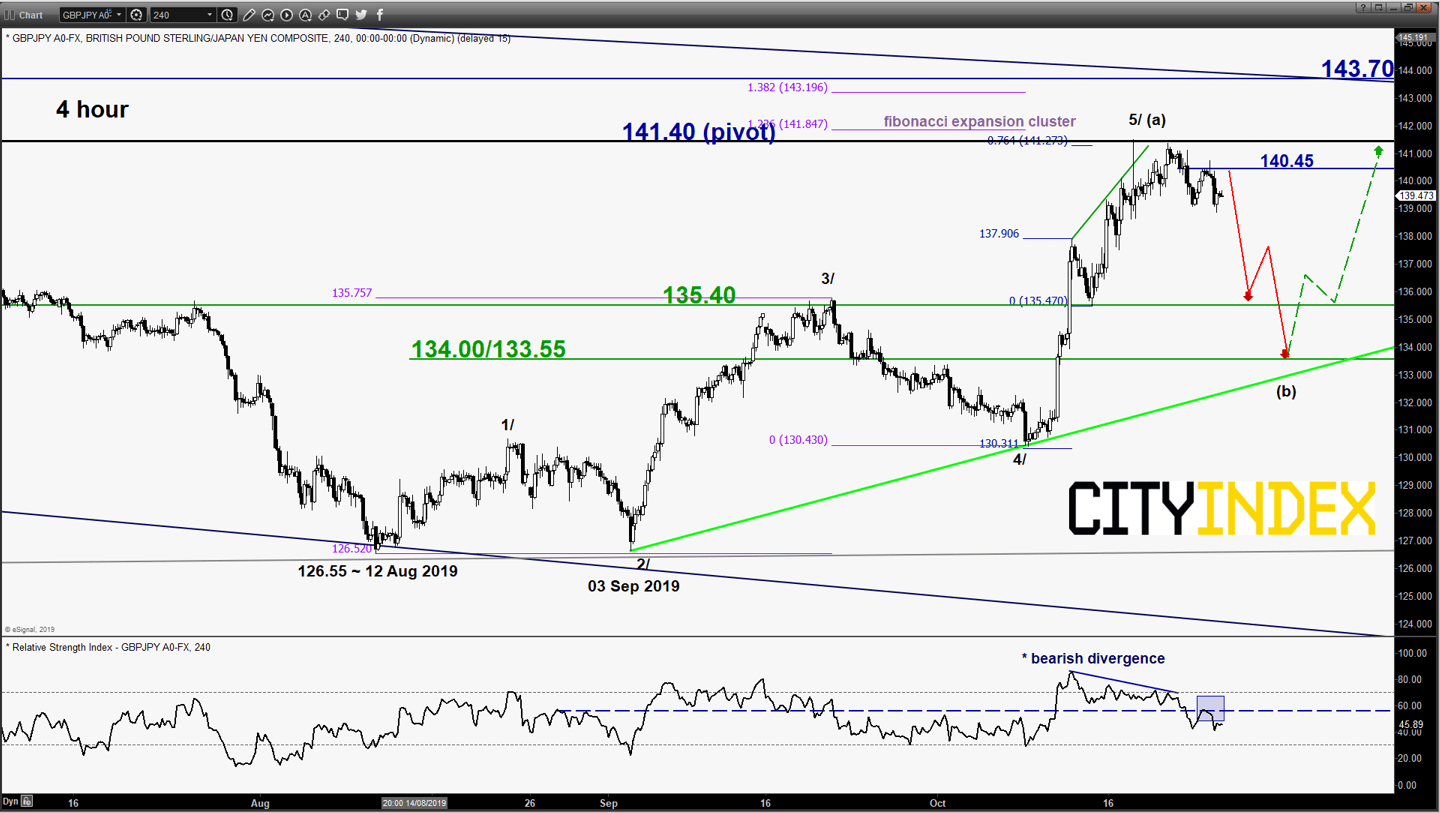
- The daily RSI oscillator has started to inch down and a test on an extreme overbought level of 81. In addition, the 4-hour RSI oscillator has shaped a bearish divergence signal at its overbought region as price action of the cross pair has continued to shape “higher highs” from 11 Oct to 21 Oct 2019. These observations suggest the recent medium-term upside momentum of price action has started to wane.
- Elliot Wave/fractal analysis also supports a potential corrective/mean reversion decline at this juncture. From its 12 Aug 2019 low of 126.55, the cross pair has completed a 5- wave up move sequence; labelled as 1/, 2/, 3/,4/ & 5/ in the 4-hour chart with a Fibonacci expansion cluster right at around the 17/21 Oct 2019 swing high area. These observations suggest that the next price action sequence may be a decline to retrace at least a third of the recent up move from 12 Aug 2019 low.
- The significant medium-term support zone of 134.00/133.55 is defined by the 50% Fibonacci retracement of the recent up move from 12 Aug low to 17 Oct 2019 high, minor congestion area from 23 Sep to 30 Sep 2019 and the ascending trendline from 03 Sep 2019 low.
Charts are from eSignal
StoneX Financial Ltd (trading as “City Index”) is an execution-only service provider. This material, whether or not it states any opinions, is for general information purposes only and it does not take into account your personal circumstances or objectives. This material has been prepared using the thoughts and opinions of the author and these may change. However, City Index does not plan to provide further updates to any material once published and it is not under any obligation to keep this material up to date. This material is short term in nature and may only relate to facts and circumstances existing at a specific time or day. Nothing in this material is (or should be considered to be) financial, investment, legal, tax or other advice and no reliance should be placed on it.
No opinion given in this material constitutes a recommendation by City Index or the author that any particular investment, security, transaction or investment strategy is suitable for any specific person. The material has not been prepared in accordance with legal requirements designed to promote the independence of investment research. Although City Index is not specifically prevented from dealing before providing this material, City Index does not seek to take advantage of the material prior to its dissemination. This material is not intended for distribution to, or use by, any person in any country or jurisdiction where such distribution or use would be contrary to local law or regulation.
For further details see our full non-independent research disclaimer and quarterly summary.
CFDs are complex instruments and come with a high risk of losing money rapidly due to leverage. 69% of retail investor accounts lose money when trading CFDs with this provider. You should consider whether you understand how CFDs work and whether you can afford to take the high risk of losing your money. CFD and Forex Trading are leveraged products and your capital is at risk. They may not be suitable for everyone. Please ensure you fully understand the risks involved by reading our full risk warning.
City Index is a trading name of StoneX Financial Ltd. Head and Registered Office: 1st Floor, Moor House, 120 London Wall, London, EC2Y 5ET. StoneX Financial Ltd is a company registered in England and Wales, number: 05616586. Authorised and regulated by the Financial Conduct Authority. FCA Register Number: 446717.
City Index is a trademark of StoneX Financial Ltd.
The information on this website is not targeted at the general public of any particular country. It is not intended for distribution to residents in any country where such distribution or use would contravene any local law or regulatory requirement.
© City Index 2024