Opportunities emerge as storm eases Gold and Silver
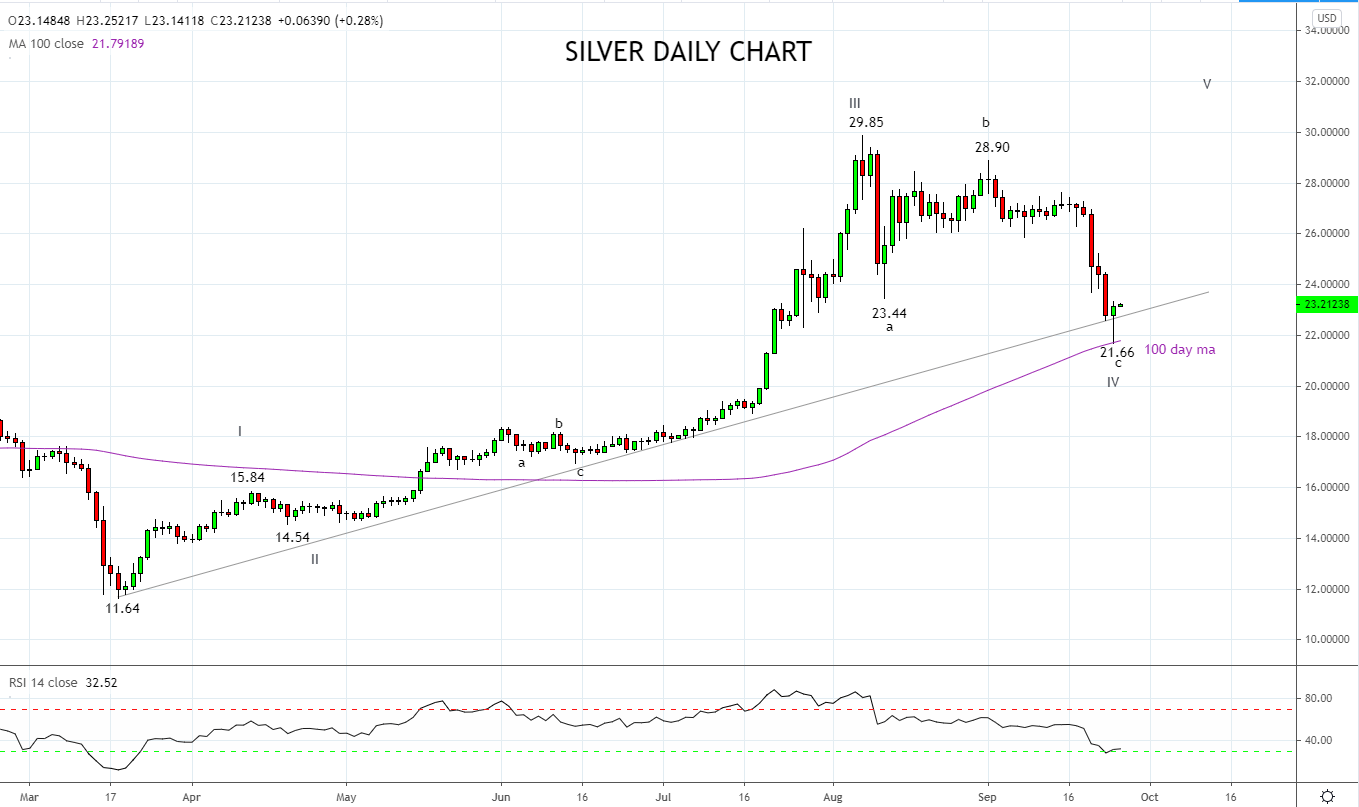
In some ways, the September storm bought a much-needed wash out of the extreme excesses that had built in recent months. Few markets exhibited quite as bullish exuberance as Silver, up over 150% in 6 months!
Enthusiasts of textbook definitions will note that Silver entered bear market territory overnight. However as can be viewed on the chart below, it may turn out to be one of the quickest bear markets in history.
The pullback from the August $29.85 high is viewed as a correction. The false break lower overnight neatly tagged the support coming from the 100-day moving average. The daily close back above trendline support and the potentially bullish daily reversal candle providing initial confirmation the corrective pullback is complete.
Should Silver, remain above the overnight low and then break and close above the band of resistance $23.50/24.00, it would suggest the uptrend has resumed (Wave V). In this instance, the expectation would be for a retest and break of the $29.85 high into year-end.
Silvers high beta characteristics makes it a leader in the precious metal space, similar to the way the Nasdaq is for other U.S equity indices. However, Silvers volatility means that it is one that only the bravest will trade.
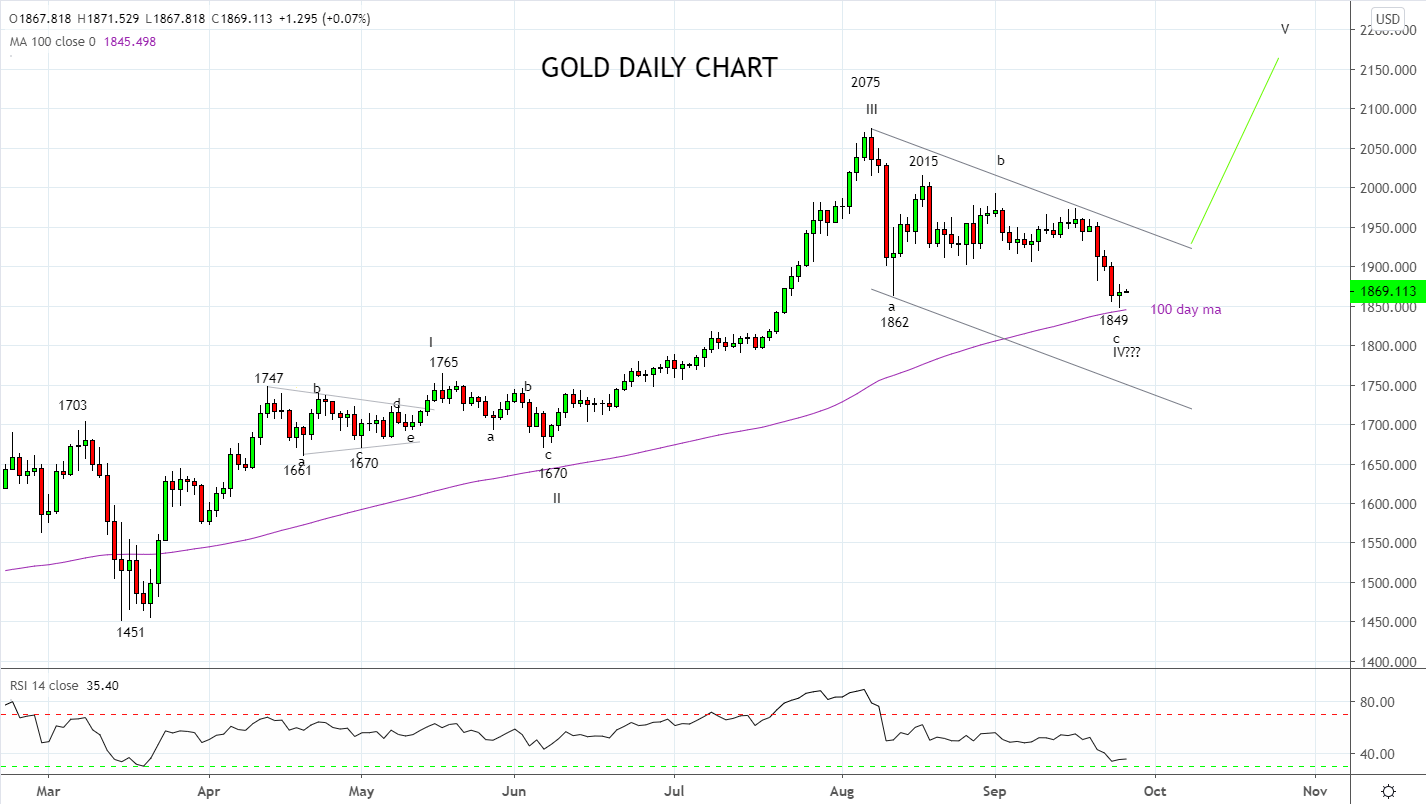
In this respect, gold is viewed as the preferred precious metal vehicle to trade and displays a similar technical structure to Silver.
While the pullback in Gold fell well short of wave equality at $1800, it also tagged the support provided by the 100 day moving average, before a potentially bullish daily candle formed.
Should gold hold above the overnight lows at $1849 and then trade above $1883.00 ($6.00 above the overnight high of $1877), I would consider opening a small long trade with a stop loss placed at $1841. The target for is a retest and break of the $2075 high, before $2400.
Keeping in mind, a break and close above the band of resistance $1910/20 would be further confirmation the uptrend has resumed.
Source Tradingview. The figures stated areas of the 25th of September 2020. Past performance is not a reliable indicator of future performance. This report does not contain and is not to be taken as containing any financial product advice or financial product recommendation
StoneX Financial Ltd (trading as “City Index”) is an execution-only service provider. This material, whether or not it states any opinions, is for general information purposes only and it does not take into account your personal circumstances or objectives. This material has been prepared using the thoughts and opinions of the author and these may change. However, City Index does not plan to provide further updates to any material once published and it is not under any obligation to keep this material up to date. This material is short term in nature and may only relate to facts and circumstances existing at a specific time or day. Nothing in this material is (or should be considered to be) financial, investment, legal, tax or other advice and no reliance should be placed on it.
No opinion given in this material constitutes a recommendation by City Index or the author that any particular investment, security, transaction or investment strategy is suitable for any specific person. The material has not been prepared in accordance with legal requirements designed to promote the independence of investment research. Although City Index is not specifically prevented from dealing before providing this material, City Index does not seek to take advantage of the material prior to its dissemination. This material is not intended for distribution to, or use by, any person in any country or jurisdiction where such distribution or use would be contrary to local law or regulation.
For further details see our full non-independent research disclaimer and quarterly summary.
CFDs are complex instruments and come with a high risk of losing money rapidly due to leverage. 69% of retail investor accounts lose money when trading CFDs with this provider. You should consider whether you understand how CFDs work and whether you can afford to take the high risk of losing your money. CFD and Forex Trading are leveraged products and your capital is at risk. They may not be suitable for everyone. Please ensure you fully understand the risks involved by reading our full risk warning.
City Index is a trading name of StoneX Financial Ltd. Head and Registered Office: 1st Floor, Moor House, 120 London Wall, London, EC2Y 5ET. StoneX Financial Ltd is a company registered in England and Wales, number: 05616586. Authorised and regulated by the Financial Conduct Authority. FCA Register Number: 446717.
City Index is a trademark of StoneX Financial Ltd.
The information on this website is not targeted at the general public of any particular country. It is not intended for distribution to residents in any country where such distribution or use would contravene any local law or regulatory requirement.
© City Index 2024