NZDJPY s advance rejected at critical zone ahead of RBNZ
Commodities have been today’s buzzword in the financial markets as oil dropped to the lowest level since the financial crisis and iron ore hit its lowest since 2005. Commodity currencies such as the AUD, NZD and CAD have been hit hard as a result. Things could get worse for the NZD should the Reserve Bank of New Zealand decide to cut interest rates tomorrow evening (or Thursday morning NZ time). As we mentioned in the weekly outlook, the RBNZ faces a difficult dilemma this week after it recently noted that it expects 2.5% to mark the low in this interest rate cutting cycle (currently 2.75%). Given the continued falls in key commodity prices, including milk, the odds slightly favour a cut. However, the market is split. So, whatever the decision, we could see a sharp move in the short term. Our base case scenario is a cut and we are therefore bearish on the NZD.
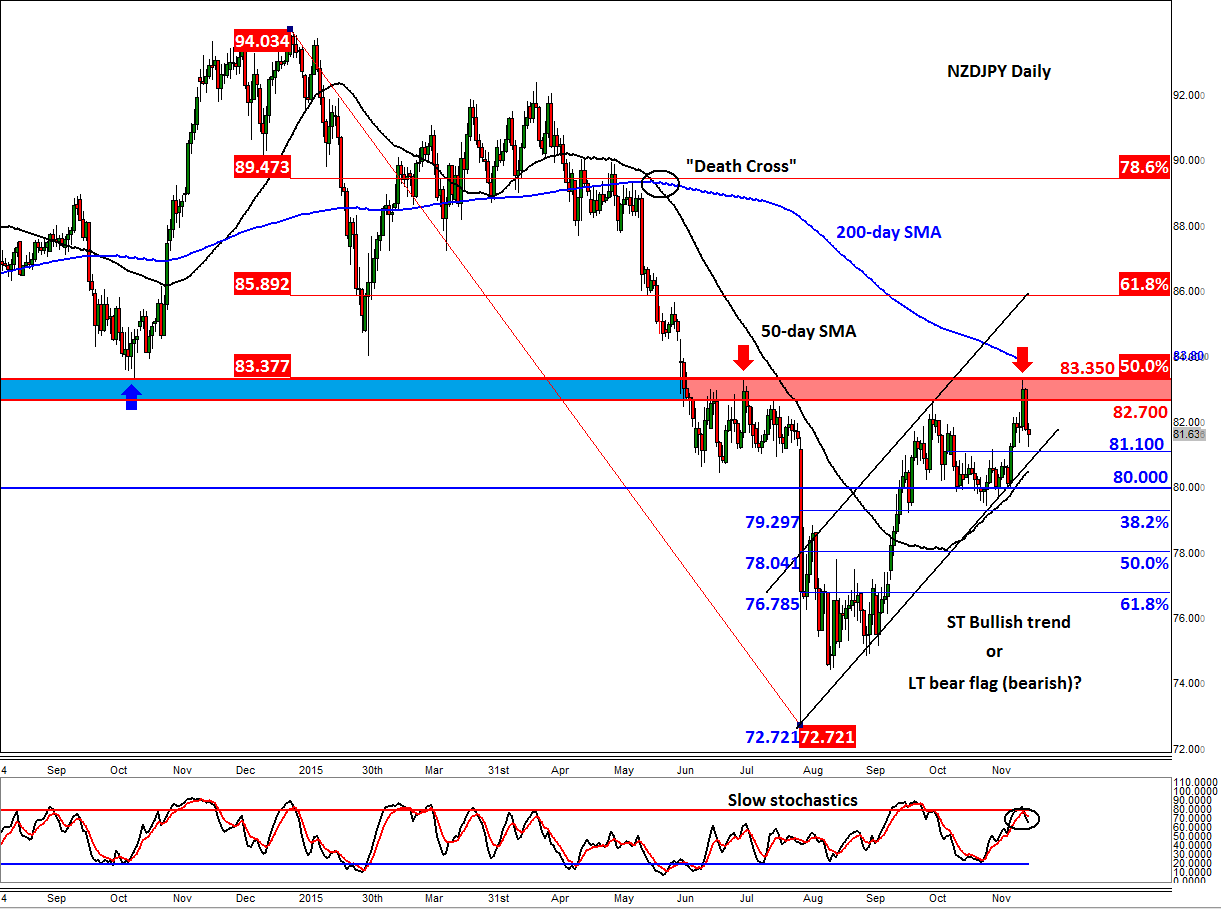
From a technical point of view, the NZD/JPY’s recent advance has been rejected at a major resistance zone between 82.70 and 83.35. As can be seen on the chart, this area was previously support and resistance, and marks the 50% retracement level of the drop from the 2014 high when it became apparent the RBNZ’s rate hiking cycle was coming to an end. The selling pressure for much of this year has caused the NZD/JPY to drop below its main moving averages and it has only recently moved back above the 50-day SMA. Nevertheless, both price and the 50-day SMA still hold below the 200-day SMA, so the trend is still technically bearish.
Since the NZD/JPY formed a low at 72.75 at the end of the summer, it has been rising inside a short-term bullish channel. But this channel could also be thought of as a longer term bear flag, which is a bearish pattern. Given the recent “risk off” tone in the financial markets and the still-dovish RBNZ, the support trend of this pattern could break down, possibly as early as this week. If so, the NZD/JPY could drop sharply in the ensuing days and possibly weeks.
Some of the short-term support levels to watch include:
- 81.10, previously resistance;
- 80.50, the 50-day SMA and the support trend of the channel/flag and
- 80.00, a psychological level.
If these levels break down then the Fibonacci retracement levels of the bounce from August would become relevant. On the other hand, if the NZD/JPY rallies, one will need to watch resistances such as 82.00, 82.70 and 83.35 closely. A potential break above the latter would expose the 200-day SMA at 83.80 for a test.
StoneX Financial Ltd (trading as “City Index”) is an execution-only service provider. This material, whether or not it states any opinions, is for general information purposes only and it does not take into account your personal circumstances or objectives. This material has been prepared using the thoughts and opinions of the author and these may change. However, City Index does not plan to provide further updates to any material once published and it is not under any obligation to keep this material up to date. This material is short term in nature and may only relate to facts and circumstances existing at a specific time or day. Nothing in this material is (or should be considered to be) financial, investment, legal, tax or other advice and no reliance should be placed on it.
No opinion given in this material constitutes a recommendation by City Index or the author that any particular investment, security, transaction or investment strategy is suitable for any specific person. The material has not been prepared in accordance with legal requirements designed to promote the independence of investment research. Although City Index is not specifically prevented from dealing before providing this material, City Index does not seek to take advantage of the material prior to its dissemination. This material is not intended for distribution to, or use by, any person in any country or jurisdiction where such distribution or use would be contrary to local law or regulation.
For further details see our full non-independent research disclaimer and quarterly summary.
CFDs are complex instruments and come with a high risk of losing money rapidly due to leverage. 69% of retail investor accounts lose money when trading CFDs with this provider. You should consider whether you understand how CFDs work and whether you can afford to take the high risk of losing your money. CFD and Forex Trading are leveraged products and your capital is at risk. They may not be suitable for everyone. Please ensure you fully understand the risks involved by reading our full risk warning.
City Index is a trading name of StoneX Financial Ltd. Head and Registered Office: 1st Floor, Moor House, 120 London Wall, London, EC2Y 5ET. StoneX Financial Ltd is a company registered in England and Wales, number: 05616586. Authorised and regulated by the Financial Conduct Authority. FCA Register Number: 446717.
City Index is a trademark of StoneX Financial Ltd.
The information on this website is not targeted at the general public of any particular country. It is not intended for distribution to residents in any country where such distribution or use would contravene any local law or regulatory requirement.
© City Index 2024