NZD USD Evening star says sun may be setting on last week s bounce
After a broad-based dip at the start of the US session, the greenback has come storming back over the last few hours. Naturally, this has caused the earlier bounce in EUR/USD to fade, though USD/JPY hasn’t seen much a corresponding rally.
One of the most interesting causalities of the dollar’s rally over the last few weeks has been the commodity complex. While most traders are likely familiar with the travails of the world’s most widely-followed commodity, gold, it’s worth noting that the industrial metals have been just as weak. To wit, nickel is down by 6% to its lowest price since 2003, while lead, aluminum and crucially, copper, have all dropped to their cheapest levels in a half decade.
Because of its widespread industrial uses and ability to accurately diagnose the performance global economy, copper is often called “Doctor Copper” by some analysts. This relationship is not infallible, as the last few years of divergence between (positive) global economic growth and the (weak) copper prices have proven, but the persistent weakness in metal prices is certainly a cause for concern among a significant contingent of market participants.
Technical view: NZD/USD
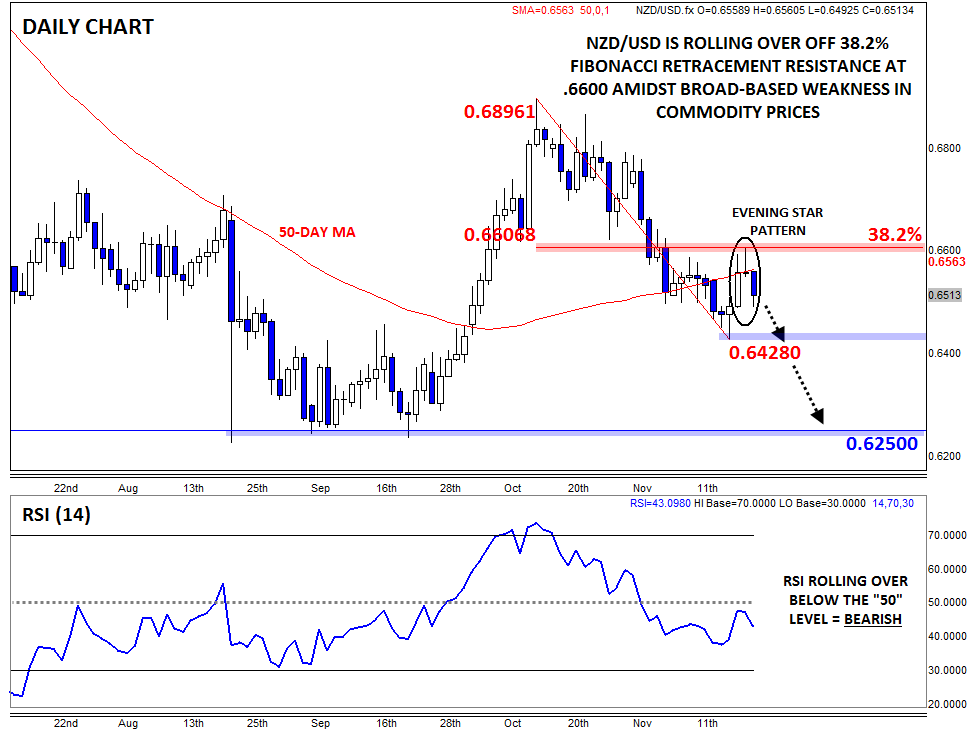
The natural correlation to watch when there’s weakness in commodities would be the aptly-named “commodity dollars” (the Canadian, Australian, and New Zealand dollars), all of which are falling today. Perhaps the best technical setup is in NZD/USD, which appears to be forming a potential daily Evening Star* formation at 38.2% Fibonacci resistance (see chart below). This relatively rare 3-candle reversal pattern shows a gradual shift from buying to neutral to selling pressure and is often seen at near-term tops in the market.
With the RSI indicator seemingly rolling over below the 50 level, NZD/USD could retest its 7-week low around .6425 sooner rather than later. If that floor is broken, rates could eventually fall further toward .6300 or even the six year lows in the .6250 zone.
* An Evening Star candle formation is relatively rare candlestick formation created by a long bullish candle, followed a small-bodied candle near the top of the first candle, and completed by a long-bodied bearish candle. It represents a transition from bullish to bearish momentum and foreshadows more weakness to come.
StoneX Financial Ltd (trading as “City Index”) is an execution-only service provider. This material, whether or not it states any opinions, is for general information purposes only and it does not take into account your personal circumstances or objectives. This material has been prepared using the thoughts and opinions of the author and these may change. However, City Index does not plan to provide further updates to any material once published and it is not under any obligation to keep this material up to date. This material is short term in nature and may only relate to facts and circumstances existing at a specific time or day. Nothing in this material is (or should be considered to be) financial, investment, legal, tax or other advice and no reliance should be placed on it.
No opinion given in this material constitutes a recommendation by City Index or the author that any particular investment, security, transaction or investment strategy is suitable for any specific person. The material has not been prepared in accordance with legal requirements designed to promote the independence of investment research. Although City Index is not specifically prevented from dealing before providing this material, City Index does not seek to take advantage of the material prior to its dissemination. This material is not intended for distribution to, or use by, any person in any country or jurisdiction where such distribution or use would be contrary to local law or regulation.
For further details see our full non-independent research disclaimer and quarterly summary.
CFDs are complex instruments and come with a high risk of losing money rapidly due to leverage. 69% of retail investor accounts lose money when trading CFDs with this provider. You should consider whether you understand how CFDs work and whether you can afford to take the high risk of losing your money. CFD and Forex Trading are leveraged products and your capital is at risk. They may not be suitable for everyone. Please ensure you fully understand the risks involved by reading our full risk warning.
City Index is a trading name of StoneX Financial Ltd. Head and Registered Office: 1st Floor, Moor House, 120 London Wall, London, EC2Y 5ET. StoneX Financial Ltd is a company registered in England and Wales, number: 05616586. Authorised and regulated by the Financial Conduct Authority. FCA Register Number: 446717.
City Index is a trademark of StoneX Financial Ltd.
The information on this website is not targeted at the general public of any particular country. It is not intended for distribution to residents in any country where such distribution or use would contravene any local law or regulatory requirement.
© City Index 2024