NZD Probes A 19 Year Trendline With A 4 Year Topping Pattern
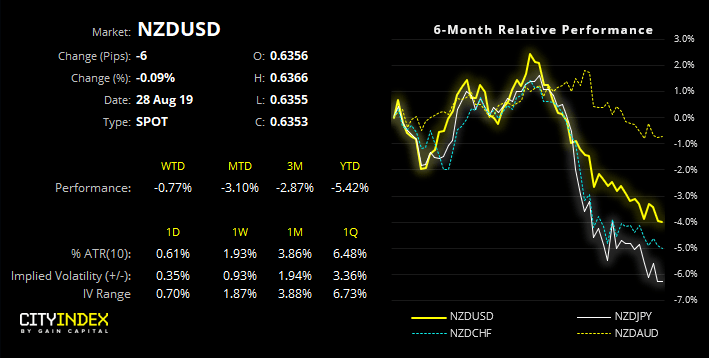
We suggest keeping a close eye on the monthly close on NZD, given the importance of the technical juncture it sits at.
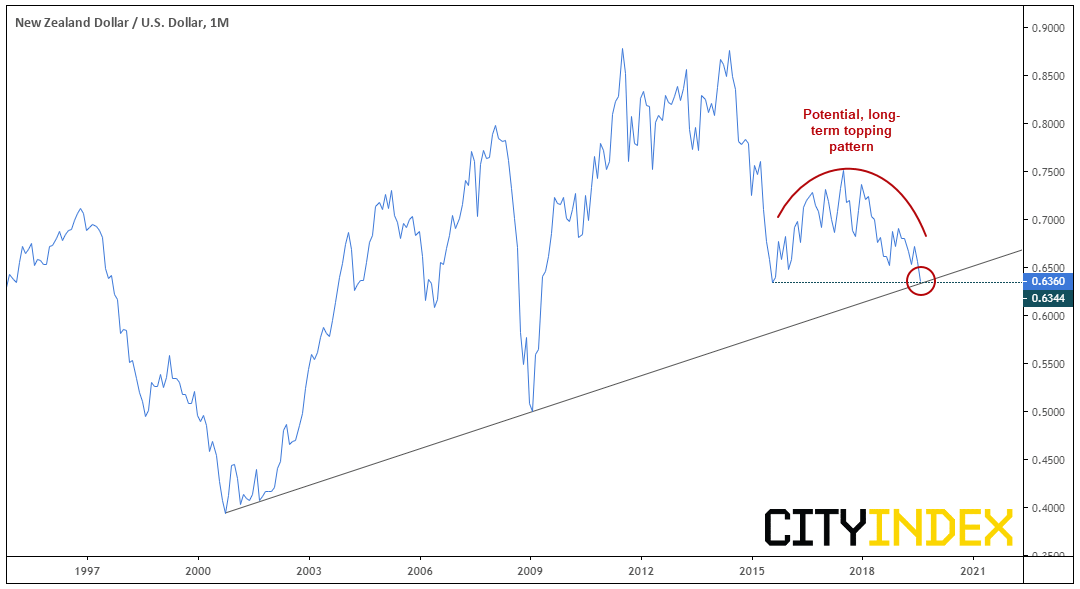
We can see on the monthly close that that NZD/USD is on the cusp of testing a key, long-term level. Prices are trading just above the August 2015 low and close to testing the bullish trendline for the October 2000 low, placing key support around 0.6344. Furthermore, a four-year topping pattern is also on the cusp of being confirmed which, if successful, could see NZD/USD drop to the mid-50’s.
Now it’s not every day a market gets to approach such a long-term level. In fact, NZD has only been close to this trendline three times since. And whilst most retail traders tend to focus on smaller timeframes (and use bar of candlestick charts), it’s worth noting that large fund managers or investors still observe closing prices, especially around such significant. Therefore, regardless of your timeframe, we suggest you keep an eye on the monthly close is it could have a material impact on prices through September.
However, we could see NZD/USD bounce from current levels over the near-term, before extending losses:
- This is a long-term, important level (which rarely break firt time around form my own observations)
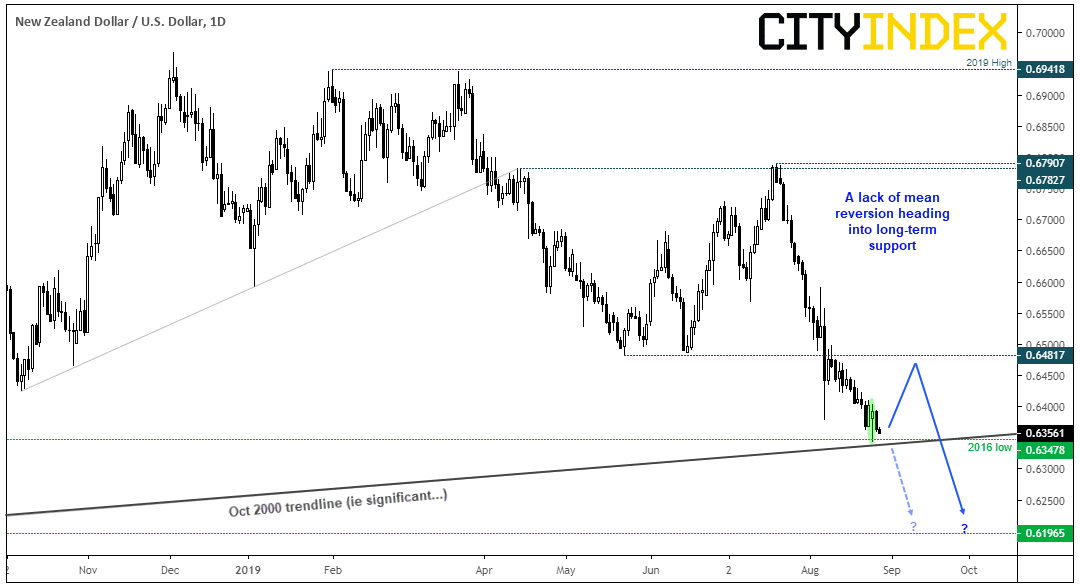
- The current decline has lacked any real mean reversion
- RBA have just cut 50bps are don’t appear in a rush to ease further. RBA Governor Orr said recently he is “pleased where we are at with policy” and just today added “monetary policy remains as effective as ever” at current setting
- OIS markets are placing a low probability of further easing any time soon, at around 4% for next month. In fact they suggest around a 50% chance of a cut in early 2020.
Monday produced a bullish hammer to show a hesitancy to break lower, although prices are sniffing around those lows at time of writing. If we are to see a bounce, traders could look for areas of weakness below 0.6482 to consider fading into. However, if we’re to see momentum shift notably higher (like a V-bottom) then we’d want to step aside over the near-term.
Obviously, let price action be your guide, so don’t fight the trend; if it breaks lower, so be it. But do remember to keep an eye on the monthly close as we’ve seen a few instances this year (ie Euro to name just one) where we saw a false break of key support heading into a new month, only to see prices violently reverse before month end. Besides, given the size of the topping pattern on the monthly chart, there could be plenty of opportunity to short it over the coming months if it does indeed break convincingly lower.
StoneX Financial Ltd (trading as “City Index”) is an execution-only service provider. This material, whether or not it states any opinions, is for general information purposes only and it does not take into account your personal circumstances or objectives. This material has been prepared using the thoughts and opinions of the author and these may change. However, City Index does not plan to provide further updates to any material once published and it is not under any obligation to keep this material up to date. This material is short term in nature and may only relate to facts and circumstances existing at a specific time or day. Nothing in this material is (or should be considered to be) financial, investment, legal, tax or other advice and no reliance should be placed on it.
No opinion given in this material constitutes a recommendation by City Index or the author that any particular investment, security, transaction or investment strategy is suitable for any specific person. The material has not been prepared in accordance with legal requirements designed to promote the independence of investment research. Although City Index is not specifically prevented from dealing before providing this material, City Index does not seek to take advantage of the material prior to its dissemination. This material is not intended for distribution to, or use by, any person in any country or jurisdiction where such distribution or use would be contrary to local law or regulation.
For further details see our full non-independent research disclaimer and quarterly summary.
CFDs are complex instruments and come with a high risk of losing money rapidly due to leverage. 69% of retail investor accounts lose money when trading CFDs with this provider. You should consider whether you understand how CFDs work and whether you can afford to take the high risk of losing your money. CFD and Forex Trading are leveraged products and your capital is at risk. They may not be suitable for everyone. Please ensure you fully understand the risks involved by reading our full risk warning.
City Index is a trading name of StoneX Financial Ltd. Head and Registered Office: 1st Floor, Moor House, 120 London Wall, London, EC2Y 5ET. StoneX Financial Ltd is a company registered in England and Wales, number: 05616586. Authorised and regulated by the Financial Conduct Authority. FCA Register Number: 446717.
City Index is a trademark of StoneX Financial Ltd.
The information on this website is not targeted at the general public of any particular country. It is not intended for distribution to residents in any country where such distribution or use would contravene any local law or regulatory requirement.
© City Index 2024