NZD JPY milking a potentially sharp move
But in which direction?
The NZD/JPY may not be the most talked-about currency pair, but following an unexpected fall in dairy prices at the Fonterra GlobalDairyTrade auction yesterday, the kiwi’s recent good run of form may have ended. Dairy prices at the auction dropped 3.1% and ended a run of four consecutive increases, while the price of powdered whole milk, New Zealand’s major export, dropped 4.6%. However, it is not all doom and gloom for New Zealand. The fall in dairy prices could just be a hiccup, while interest rates in New Zealand are among the highest in developed economies due in part to the housing market boom in Auckland. Indeed, if risk sentiment improves then the NZD could start to outperform, especially against currencies where the central bank is dovish, such as the yen and euro. So at this stage it is not very clear which direction the NZD/JPY is headed, but depending on the direction of its next move, we could see some significant follow-through in that direction.
As a result of the drop in the GDT index, the kiwi has weakened across the board, with the NZD/USD dropping below the key 0.6800 technical level and AUD/NZD forming a large bullish engulfing candle on its daily chart, though the latter is held back by an underperforming AUD and also the 200-day moving average which is offering some resistance. The NZD/JPY is probably one of the more interesting kiwi crosses to watch for the USD/JPY has retreated back to the pivotal 120.00 handle where it may find some resistance in the near term.
The yen weakened overnight following the release of some disappointing trade figures from Japan which showed the slowest pace of growth for exports in more than a year in September, as a drop in shipments to Asia, most notably China, offset gains in sales to Europe and the US. Imports meanwhile dropped 11%. Going forward, if the weakness persists for Japanese data then this would raise the pressure on the Bank of Japan to increase its stimulus measures, particularly if we see negative growth for the third quarter which would put the economy in a technical recession. This could weigh heavily on the yen and lift the Nikkei index.
Nevertheless, the yen could come back in the short term, especially as it is starting to look a little bit overbought against the USD. Indeed, given the technical importance of the 120 handle, we wouldn’t be surprised if the USD/JPY turns back lower from around here, which could help to accelerate the NZD/JPY’s potential drop.
On the other hand, if the USD/JPY continues to push higher now and the NZD also stabilises then the NZD/JPY could potentially move sharply higher as the sellers abandon their positions. So, there could be decent trading opportunities on either side for the NZD/JPY, depending on the direction of the break.
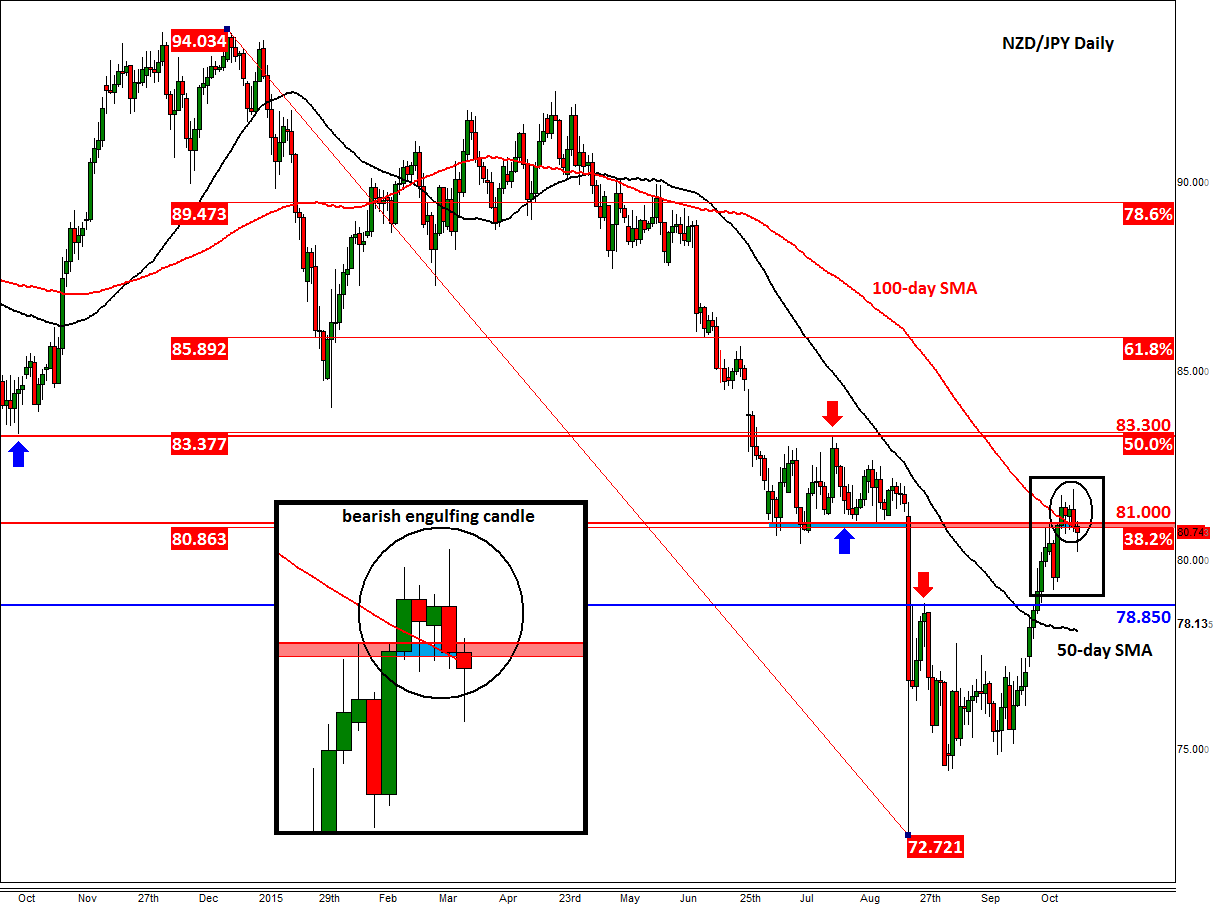
Yesterday, the NZD/JPY formed a bearish-engulfing-like candle on its daily chart which has seen the cross move back below the technically-important level of 81.00 (previous support-turned-resistance and 100-day moving average). So, for as long as price now remains below here then the path of least resistance would be to the downside. But a close back above this level and a potential break above the high of yesterday’s candle, around 81.90, would invalidate this short-term bearish outlook, possibly leading to some sharp gains.
Thus, conservative bullish traders may wish to wait until the NZD/JPY clears 81.90 before showing their presence, while the bears will be happy for as long as 81.00 caps the upside.
On the downside, the next potential support is the psychologically-important 80.00 handle, followed by the previous resistance at 78.85 and then the 50-day SMA around 78.15. On the upside, the next major resistance is at 83.30/40, an area which was formerly support and resistance and corresponds with the 50% retracement level of the downswing from the significant high of around 94.00, hit in December of last year, to August’s low of 72.70.
StoneX Financial Ltd (trading as “City Index”) is an execution-only service provider. This material, whether or not it states any opinions, is for general information purposes only and it does not take into account your personal circumstances or objectives. This material has been prepared using the thoughts and opinions of the author and these may change. However, City Index does not plan to provide further updates to any material once published and it is not under any obligation to keep this material up to date. This material is short term in nature and may only relate to facts and circumstances existing at a specific time or day. Nothing in this material is (or should be considered to be) financial, investment, legal, tax or other advice and no reliance should be placed on it.
No opinion given in this material constitutes a recommendation by City Index or the author that any particular investment, security, transaction or investment strategy is suitable for any specific person. The material has not been prepared in accordance with legal requirements designed to promote the independence of investment research. Although City Index is not specifically prevented from dealing before providing this material, City Index does not seek to take advantage of the material prior to its dissemination. This material is not intended for distribution to, or use by, any person in any country or jurisdiction where such distribution or use would be contrary to local law or regulation.
For further details see our full non-independent research disclaimer and quarterly summary.
CFDs are complex instruments and come with a high risk of losing money rapidly due to leverage. 69% of retail investor accounts lose money when trading CFDs with this provider. You should consider whether you understand how CFDs work and whether you can afford to take the high risk of losing your money. CFD and Forex Trading are leveraged products and your capital is at risk. They may not be suitable for everyone. Please ensure you fully understand the risks involved by reading our full risk warning.
City Index is a trading name of StoneX Financial Ltd. Head and Registered Office: 1st Floor, Moor House, 120 London Wall, London, EC2Y 5ET. StoneX Financial Ltd is a company registered in England and Wales, number: 05616586. Authorised and regulated by the Financial Conduct Authority. FCA Register Number: 446717.
City Index is a trademark of StoneX Financial Ltd.
The information on this website is not targeted at the general public of any particular country. It is not intended for distribution to residents in any country where such distribution or use would contravene any local law or regulatory requirement.
© City Index 2024