NZD JPY key non USD pair in this election week
For obvious reasons, the focus in the FX markets is on the dollar this week. Much has been said about it: if Clinton wins, this will happen and if Trump wins that will happen. The truth is, no one knows what will actually happen, though we can have a good idea about what may happen. Now if you are like me, you cannot wait for the elections to be over so that we can actually concentrate on the US economy again and not on politics. If you are like me, you also wouldn’t like to be heavily-exposed to the dollar in the run up to the elections. This is when some FX crosses come handy. One such pair is the NZD/JPY, though it is not entirely immune to US elections, for it is considered to be a risk-sensitive FX pair.
RBNZ widely expected to cut interest rates
Nevertheless, the NZD/JPY is among the most interesting non-USD pairs to watch this week, for not only has it created an interesting bullish technical signal (see the details below), there is also the small matter of the Reserve Bank of New Zealand’s policy decision to consider in midweek. The RBNZ is widely expected to cut interest rates by another 25 basis points to 1.75% from the current record low rate of 2.0%. However, the recent improvement in both domestic economic data and the prices of the nation’s largest exports, dairy products, may see the RBNZ hold fire at this meeting and thus disappoint those looking for a rate cut. In this potential scenario, the NZD could rally sharply. Even if the RBNZ were to cut rates by 0.25%, the potential negative reaction in the NZD could be short-lived as after all this will be an expected move. So, unless the RBNZ is extremely dovish (i.e. an actual rate cut plus warning of more cuts down the line), the NZD/JPY could resume its upward move after a potentially short-lived knee-jerk reaction lower on Wednesday evening or Thursday morning NZ time.
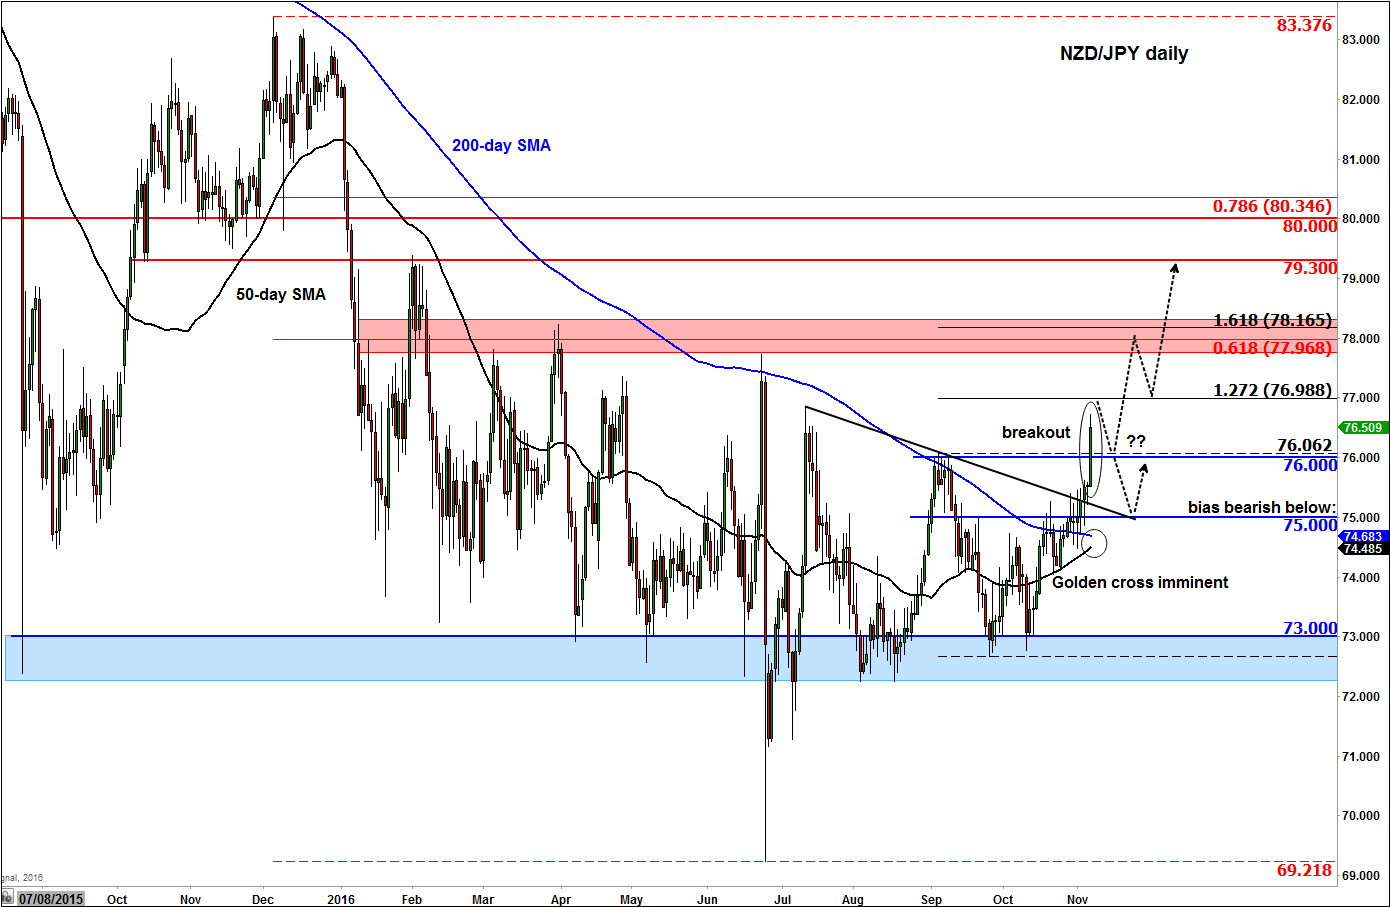
NZD/JPY in bullish breakout
From a technical point of view, the NZD/JPY appears to have finally broken higher after a very lengthy consolidation in a relatively tight range around the psychologically-important level of 75.00. As can be seen from the chart, the pair has recently moved above its 50- and 200-day moving averages, a bearish trend line and now the previous short-term swing high around 76.00 – a level which could turn into support on a potential re-test. The 50-day average is now pointing higher and is about to cross above the 200-day average to create a so-called “golden crossover.” This crossover is often a prerequisite for some swing traders and trend followers looking for long opportunities. I should point out here that the crossover itself is not necessarily – and should not be – the trigger for a trade as the moving averages are lagging indicators. Think of the crossover as a filtering process: bullish when 50>200 and bearish when 50<200. better="" still="" would="" be="" when="" both="" of="" the="" moving="" averages="" are="" pointing="" in="" the="" same="" direction,="" which="" in="" the="" case="" of="" the="" nzd/jpy="" could="" still="" take="" a="">
Amway, it looks like the NZD/JPY could be heading higher, so I just wanted to through this in for those looking for non-USD ideas this week. Technically the short-term bias would become weak if support at 76.00 gives way and become completely invalid upon a break back below 75.00. Assuming that this does will not happen, we can keep the focus on levels above 76.00 i.e. bullish objectives. In this regard, the Fibonacci extension levels of the most recent downswing at 77.00 (127.2%) and 78.15 (161.8%) could be the immediate targets to watch. Just below 78.15 (around 78.00) is the longer-term 61.8% Fibonacci retracement of the downward move from December. So, the area around 78.00 is the next key level to watch on the upside.
StoneX Financial Ltd (trading as “City Index”) is an execution-only service provider. This material, whether or not it states any opinions, is for general information purposes only and it does not take into account your personal circumstances or objectives. This material has been prepared using the thoughts and opinions of the author and these may change. However, City Index does not plan to provide further updates to any material once published and it is not under any obligation to keep this material up to date. This material is short term in nature and may only relate to facts and circumstances existing at a specific time or day. Nothing in this material is (or should be considered to be) financial, investment, legal, tax or other advice and no reliance should be placed on it.
No opinion given in this material constitutes a recommendation by City Index or the author that any particular investment, security, transaction or investment strategy is suitable for any specific person. The material has not been prepared in accordance with legal requirements designed to promote the independence of investment research. Although City Index is not specifically prevented from dealing before providing this material, City Index does not seek to take advantage of the material prior to its dissemination. This material is not intended for distribution to, or use by, any person in any country or jurisdiction where such distribution or use would be contrary to local law or regulation.
For further details see our full non-independent research disclaimer and quarterly summary.
CFDs are complex instruments and come with a high risk of losing money rapidly due to leverage. 69% of retail investor accounts lose money when trading CFDs with this provider. You should consider whether you understand how CFDs work and whether you can afford to take the high risk of losing your money. CFD and Forex Trading are leveraged products and your capital is at risk. They may not be suitable for everyone. Please ensure you fully understand the risks involved by reading our full risk warning.
City Index is a trading name of StoneX Financial Ltd. Head and Registered Office: 1st Floor, Moor House, 120 London Wall, London, EC2Y 5ET. StoneX Financial Ltd is a company registered in England and Wales, number: 05616586. Authorised and regulated by the Financial Conduct Authority. FCA Register Number: 446717.
City Index is a trademark of StoneX Financial Ltd.
The information on this website is not targeted at the general public of any particular country. It is not intended for distribution to residents in any country where such distribution or use would contravene any local law or regulatory requirement.
© City Index 2024