NZD JPY heading and shouldering lower
As we noted yesterday, the New Zealand dollar (and associated economic data) was serving as a “warm up” act for the “main event” US and UK data to come. Based on what we’ve seen though, it was a rather disappointing warm up, at least for kiwi bulls.
Following yesterday’s disappointing GDT auction data, traders learned that the New Zealand economy actually saw a 0.4% decline in employment in Q3, badly missing the expectations for a 0.4% rise. Meanwhile, the unemployment rate in the island nation rose to 6.0%, as anticipated. This disappointing report raises the risk that the Reserve Bank of New Zealand will have to cut interest rates by year-end, and the kiwi has suffered as a result.
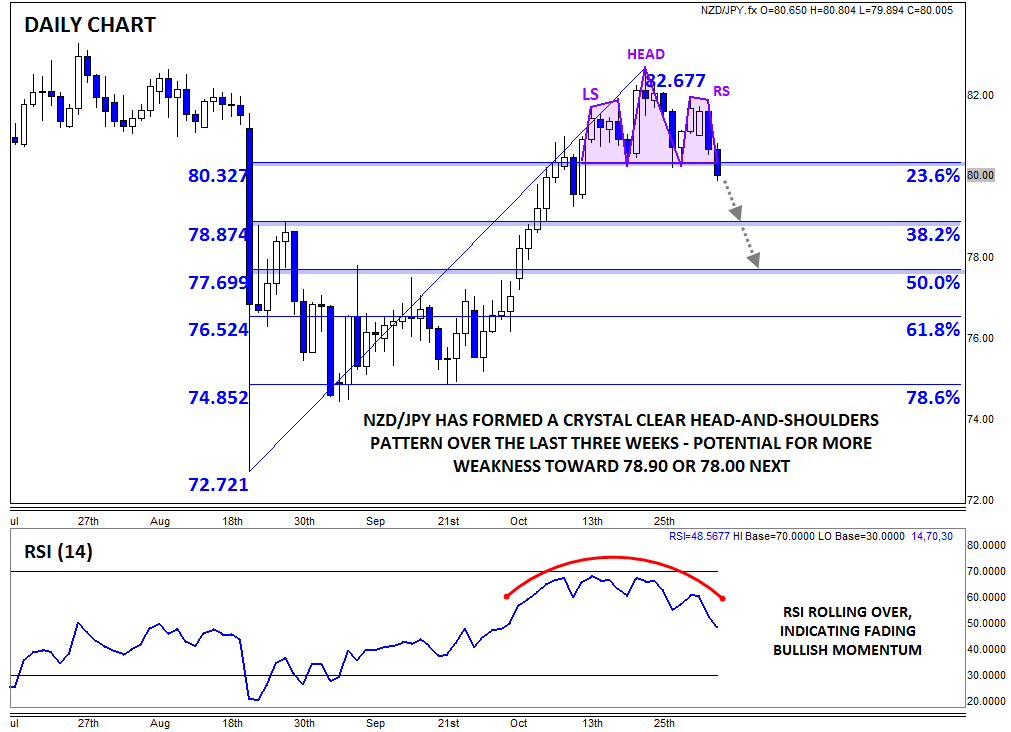
Potentially the most interesting pair to watch is NZD/JPY, which has formed a crystal clear head-and-shoulders pattern over the last three weeks. For the uninitiated, this classic price action pattern shows a shift from an uptrend (higher highs and higher lows) to a downtrend (lower lows and lower highs) and is typically seen at major tops in the chart.
Just yesterday, the pair broke below its neckline (which coincided with the 23.6% Fibonacci retracement at 80.30), confirming the pattern and opening the door for a big leg lower. The recent rounded top in the RSI indicator also supports the view that the bullish momentum has rolled over.
Based on the measured move objective (the height of the pattern, 230 pips, projected down from the neckline), NZD/JPY could all the way to 78.00, but more conservative traders may want to look toward the 38.2% Fibonacci retracement at 78.90 as a more attainable target. At this point, only a strong rally back above the right shoulder at 82.00 would turn the bias back in favor of the buyers.
StoneX Financial Ltd (trading as “City Index”) is an execution-only service provider. This material, whether or not it states any opinions, is for general information purposes only and it does not take into account your personal circumstances or objectives. This material has been prepared using the thoughts and opinions of the author and these may change. However, City Index does not plan to provide further updates to any material once published and it is not under any obligation to keep this material up to date. This material is short term in nature and may only relate to facts and circumstances existing at a specific time or day. Nothing in this material is (or should be considered to be) financial, investment, legal, tax or other advice and no reliance should be placed on it.
No opinion given in this material constitutes a recommendation by City Index or the author that any particular investment, security, transaction or investment strategy is suitable for any specific person. The material has not been prepared in accordance with legal requirements designed to promote the independence of investment research. Although City Index is not specifically prevented from dealing before providing this material, City Index does not seek to take advantage of the material prior to its dissemination. This material is not intended for distribution to, or use by, any person in any country or jurisdiction where such distribution or use would be contrary to local law or regulation.
For further details see our full non-independent research disclaimer and quarterly summary.
CFDs are complex instruments and come with a high risk of losing money rapidly due to leverage. 69% of retail investor accounts lose money when trading CFDs with this provider. You should consider whether you understand how CFDs work and whether you can afford to take the high risk of losing your money. CFD and Forex Trading are leveraged products and your capital is at risk. They may not be suitable for everyone. Please ensure you fully understand the risks involved by reading our full risk warning.
City Index is a trading name of StoneX Financial Ltd. Head and Registered Office: 1st Floor, Moor House, 120 London Wall, London, EC2Y 5ET. StoneX Financial Ltd is a company registered in England and Wales, number: 05616586. Authorised and regulated by the Financial Conduct Authority. FCA Register Number: 446717.
City Index is a trademark of StoneX Financial Ltd.
The information on this website is not targeted at the general public of any particular country. It is not intended for distribution to residents in any country where such distribution or use would contravene any local law or regulatory requirement.
© City Index 2024