Not dovish enough FOMC sets up possible double top in SP500
Disappointment centred on the absence of discussion around extending the maturity of asset purchases and lukewarm enthusiasm for the implementation of yield curve control (YCC). The prospects of both have been instrumental in driving real yields lower.
Without these twin anchors, the FOMC minutes cut free the portfolio of trades that have thrived in recent weeks including long gold, short the U.S. dollar, and long equities. Mindful that the unwind in these trades is likely to have occurred on lighter volumes, found during the Northern Hemisphere summer and that moves that occur on low volumes can easily be retraced.
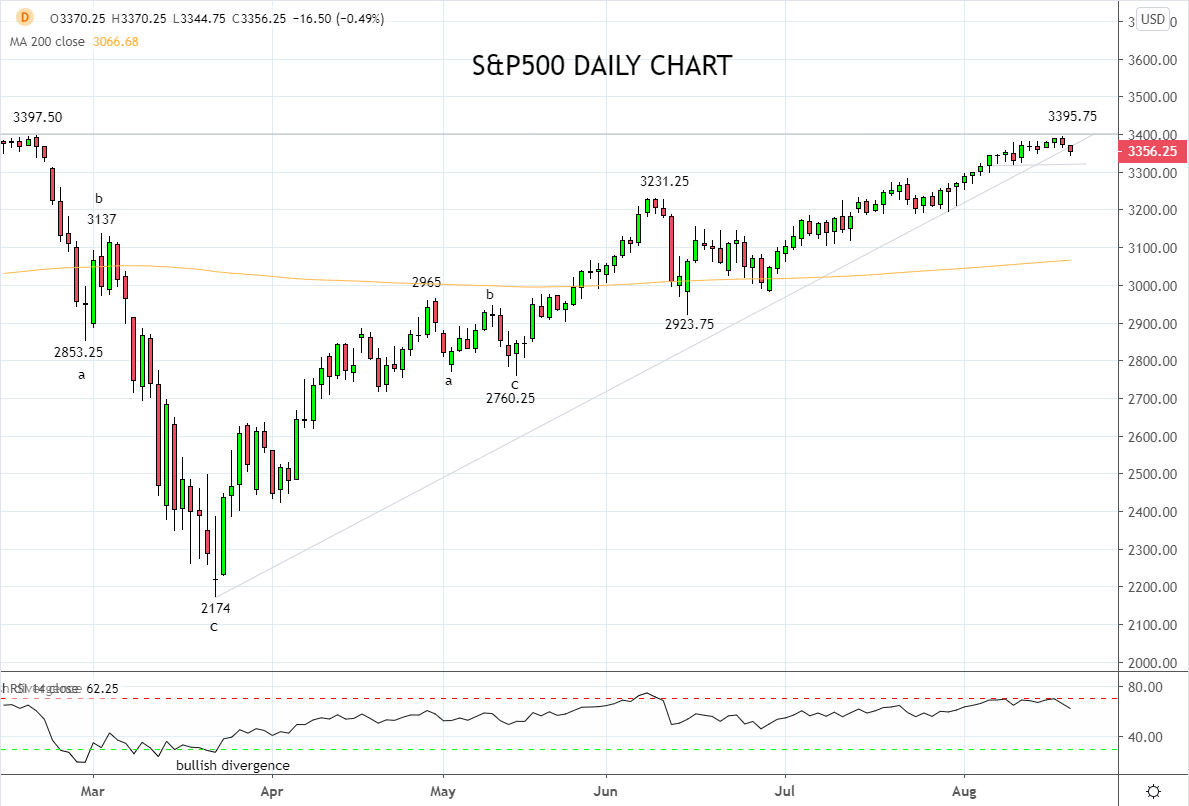
However, when viewed on a chart, the S&P500’s recent price action makes does make it somewhat difficult to be overly enthusiastic about its immediate upside prospects.
In particular, the pattern of new cycle highs on waning momentum is usually viewed at the tail end of moves, rather than midway through. Also notable the possibility of a double top at all-time highs, and the break of trendline support from the March 2174 low. Finally, the divergence between the high beta Nasdaq and the broader market is something that is frequently witnessed at turning points.
In light of the above, I am watching for a sustained break of recent lows 3320/10 to indicate the uptrend has faltered. The possibility of a corrective pullback increasing on a break below medium-term support 3280/70, and indicative that a pullback towards the 200 day moving average at 3065 is underway.
Keeping in mind that should the S&P500 continue to hold above the near term 3320/10 support and medium-term support 3280/70, allow for a retest and break of the all-time highs at 3397.50, before a move towards 3500/3600 into year-end.
Source Tradingview. The figures stated areas of the 20th of August 2020. Past performance is not a reliable indicator of future performance. This report does not contain and is not to be taken as containing any financial product advice or financial product recommendation
StoneX Financial Ltd (trading as “City Index”) is an execution-only service provider. This material, whether or not it states any opinions, is for general information purposes only and it does not take into account your personal circumstances or objectives. This material has been prepared using the thoughts and opinions of the author and these may change. However, City Index does not plan to provide further updates to any material once published and it is not under any obligation to keep this material up to date. This material is short term in nature and may only relate to facts and circumstances existing at a specific time or day. Nothing in this material is (or should be considered to be) financial, investment, legal, tax or other advice and no reliance should be placed on it.
No opinion given in this material constitutes a recommendation by City Index or the author that any particular investment, security, transaction or investment strategy is suitable for any specific person. The material has not been prepared in accordance with legal requirements designed to promote the independence of investment research. Although City Index is not specifically prevented from dealing before providing this material, City Index does not seek to take advantage of the material prior to its dissemination. This material is not intended for distribution to, or use by, any person in any country or jurisdiction where such distribution or use would be contrary to local law or regulation.
For further details see our full non-independent research disclaimer and quarterly summary.
CFDs are complex instruments and come with a high risk of losing money rapidly due to leverage. 69% of retail investor accounts lose money when trading CFDs with this provider. You should consider whether you understand how CFDs work and whether you can afford to take the high risk of losing your money. CFD and Forex Trading are leveraged products and your capital is at risk. They may not be suitable for everyone. Please ensure you fully understand the risks involved by reading our full risk warning.
City Index is a trading name of StoneX Financial Ltd. Head and Registered Office: 1st Floor, Moor House, 120 London Wall, London, EC2Y 5ET. StoneX Financial Ltd is a company registered in England and Wales, number: 05616586. Authorised and regulated by the Financial Conduct Authority. FCA Register Number: 446717.
City Index is a trademark of StoneX Financial Ltd.
The information on this website is not targeted at the general public of any particular country. It is not intended for distribution to residents in any country where such distribution or use would contravene any local law or regulatory requirement.
© City Index 2024