Nikkei stock market volatility here to stay next week
The Japanese stock markets closed up another 3% on Friday as its impressive kick-back rally in the second half of the week continued unabated. Sentiment has been boosted in part by the surprisingly strong upward revision in US GDP, a solid finish on Wall Street and after the release of mostly better-than-expected domestic data. Retail sales increased 1.6% year-over-year in July, the unemployment rate fell to 3.3% from 3.4% and the national core CPI measure of inflation was flat when a 0.2% drop was expected. However it wasn’t all good news as household spending unexpectedly fell 0.2%. Though there are not much Japanese data scheduled for next week, there will be plenty of macro pointers from the world’s two largest economies to look forward to. For China, the key data will be the latest manufacturing PMI. Stock market bulls will want to see a strong number obviously, but if this disappoints expectations then the Chinese hard landing fears may come back to the forefront, causing even more volatility for the Asian stock markets. In the US, it is the “NFP week.” Several employment market indicators will be released throughout the week, culminating in the official jobs report on Friday. This particular jobs report may well be the deciding factor if we are to see a 2015 rate hike. If the number comes out much stronger than expected then it is likely that the USD/JPY will rally, which in turn may boost the Nikkei as after all a stronger USD and weaker JPY is good news for Japanese exporters. However it will be interesting to see how the US markets will react as an earlier rate hike is not good news for domestic companies.
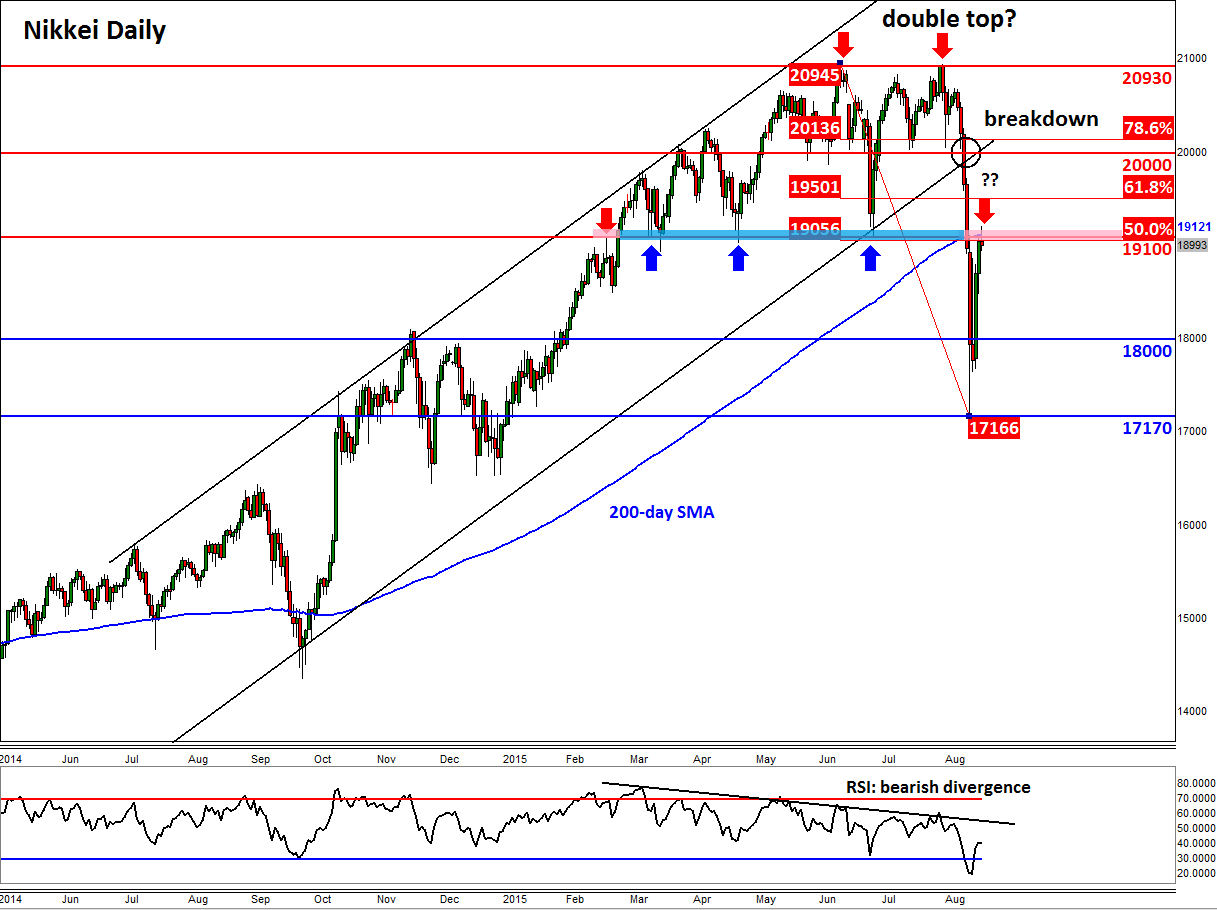
So, next week could be another volatile one for the stock markets. Now, you may be wondering why we are concentrating on the Nikkei as opposed to, say, a US index given the sheer number of high-impact US data in the week ahead. Well, part of the reason is that we are planning to write up on the US markets next week anyway. But as we are also technically-minded analysts and traders, the Nikkei chart is looking the most interesting out of all the major indices. As can be seen from the chart, the Japanese benchmark index has already formed a double top reversal pattern, which was confirmed by the breakout from the bullish channel around 20,000. From its peak of above 20900, the index went on to plummet all the way to a low of under 17200 in the space of about 2 weeks, representing a huge drop of 3,700 points or 18%. But this week the index has managed to bounce back some 2,000 points or an impressive 11% from low to peak. Will this momentum carry forward into next week? We are doubtful. After all, it is not unusual to see wild swings like these when major trends change course. Growth concerns about China are still there and the Fed may still increase interest rates later this year. There will also be plenty of buyers who may still hold large losing positions. This group of market participants may choose to exit their positions when they have the opportunity to do so. Thus, the sellers could return soon, possibly early next week. So, be wary of another leg lower across the major stock indices.
Indeed, the Japanese index has now returned to a key turning point around 19100 to 19200. This area had been strong support in the past, but now that it has been broken down it may turn into resistance. In addition to this simple support-turned-resistance area, we have the 200-day moving average also converging inside this range, at 19120. Thus, we wouldn’t be surprised if the index were to turn lower from here once again and potentially revisit or even break the lows that were hit earlier this week. However if the bulls win the battle here, then the short-term bias would turn back bullish and a rally towards the 61.8% Fibonacci level at 19,500 or the point of origin of the breakout around 20,000 could be the most likely outcome.
StoneX Financial Ltd (trading as “City Index”) is an execution-only service provider. This material, whether or not it states any opinions, is for general information purposes only and it does not take into account your personal circumstances or objectives. This material has been prepared using the thoughts and opinions of the author and these may change. However, City Index does not plan to provide further updates to any material once published and it is not under any obligation to keep this material up to date. This material is short term in nature and may only relate to facts and circumstances existing at a specific time or day. Nothing in this material is (or should be considered to be) financial, investment, legal, tax or other advice and no reliance should be placed on it.
No opinion given in this material constitutes a recommendation by City Index or the author that any particular investment, security, transaction or investment strategy is suitable for any specific person. The material has not been prepared in accordance with legal requirements designed to promote the independence of investment research. Although City Index is not specifically prevented from dealing before providing this material, City Index does not seek to take advantage of the material prior to its dissemination. This material is not intended for distribution to, or use by, any person in any country or jurisdiction where such distribution or use would be contrary to local law or regulation.
For further details see our full non-independent research disclaimer and quarterly summary.
CFDs are complex instruments and come with a high risk of losing money rapidly due to leverage. 69% of retail investor accounts lose money when trading CFDs with this provider. You should consider whether you understand how CFDs work and whether you can afford to take the high risk of losing your money. CFD and Forex Trading are leveraged products and your capital is at risk. They may not be suitable for everyone. Please ensure you fully understand the risks involved by reading our full risk warning.
City Index is a trading name of StoneX Financial Ltd. Head and Registered Office: 1st Floor, Moor House, 120 London Wall, London, EC2Y 5ET. StoneX Financial Ltd is a company registered in England and Wales, number: 05616586. Authorised and regulated by the Financial Conduct Authority. FCA Register Number: 446717.
City Index is a trademark of StoneX Financial Ltd.
The information on this website is not targeted at the general public of any particular country. It is not intended for distribution to residents in any country where such distribution or use would contravene any local law or regulatory requirement.
© City Index 2024