Nikkei s next stimulus may arrive too late
What do you give a stock market that in theory has a lot going for it?
Well, possibly a miss right now, judging by the behaviour of investors in Japan’s main equity index the Nikkei 225.
Yellen tips yen ‘counterweight’
Tokyo’s benchmark closed lower for a second consecutive session on Wednesday after its perennial counterweight, the yen, looked set to resume recent strength against the dollar, adding weight to Japan’s export-biased corporate sector.
This came after US Federal Reserve Chair Janet Yellen reiterated in a Tuesday speech that the central bank would proceed “cautiously” with raising interest rates.
Even before the Fed’s more dovish recent turn though, theoretical advantages that might have flowed from Japan’s central bank affirming an easing path in January had not materialised unequivocally for the Nikkei.
Japan’s main stock gauge has advanced 13.5% from February lows, outpacing the yen’s steady 12% climb between late December and earlier this month.
But the recent slight recoupment of the dollar has not convinced investors the market has the further strength required to surpass looming technical barriers.
Ex-growth economy vs. ex-dividend stocks
Under these circumstances, even structural factors that might have stoked more buying did not play out as positively as some market participants hoped.
For instance the 31st March business year-end for a majority of Japanese firms prompted buying ahead of several stocks going ex-dividend on 4th April.
But the incentive didn’t last long.
Mixed economic messages from major trading partner the US and in Japan itself over the last week or so have not helped.
Japanese household spending rose 1.2% in February from a year earlier, against consensus for a fall.
But the country’s jobless rate inched up to 3.3%, and retail sales fell short.
Even before Janet Yellen confirmed on Tuesday that the Fed had grown more cautious within the space of a few weeks, US economic data had also shown signs of weakness.
Consumer spending barely rose last month and inflation retreated, recent data showed.
That suggested the Fed could remain cautious about raising interest rates this year even as the labour market rapidly tightens.
Accommodation gets colder
In previous years, weak economic signals globally and in Japan itself had as often as not bolstered market sentiment, given the expectation that the Bank of Japan and Ministry of Finance would press on with accommodative measures.
More recently, the BoJ and Prime Minister Shinzo Abe’s government have been slow to endorse and even eager to quash such hopes.
For instance, Abe insisted on Tuesday that the government would go ahead with an unpopular sales tax hike.
The PM also ruled out burgeoning speculation of a snap election, stemming talk which had capped the yen.
As for the central bank, the monetary policy board made clear at its March meeting that a decision in January to apply a negative 0.1% rate to certain deposits, came with big provisos.
One board member said the action, coming after the extension of the December stimulus plan—ongoing since 2013—could be ‘misinterpreted’.
The Bank refrained from bolstering its record stimulus in March, as policy makers indicated more time was needed to gauge negative rates.
Waiting for Kuroda
However, with the BoJ far from its 2% inflation goal and growth stalling, the hope for additional stimulus measures has been kept alive.
The stakes are seen as rising for the BoJ’s Governor, Haruhiko Kuroda, with household and corporate sentiment waning and investors questioning whether monetary policy is reaching its limits.
Kuroda said at a post-decision briefing in March that he didn’t need to wait to see the full impact of the negative rate before acting again, if change is needed.
Even so, consensus forecasts point most strongly to the BoJ’s 29th July announcement as the likeliest date it might kick off more stimulus, rather than April or June.
Given that tentative assessment, whilst this week still has several important economic releases on the calendar, in Japan and the US—including Japan’s quarterly Tankan manufacturing index and the US monthly jobs report—any sustained Nikkei impetus is unlikely to come from expectations of very near-term policy boosts.
These circumstances leave the Nikkei index poised at a precarious edge, technically speaking.
DAILY CHART
Please click image to enlarge
The market has clear support from 16901.5, the September 2015 launching point of the market’s temporary revival.
It is also underpinned by a remarkable high/low pivot at 16592.6.
The line was in effect on 31st October 2014, 16th January 2015, as well as late January, early February and several times in March this year.
But the Nikkei has also faced several setbacks over the last few months in attempts to get beyond 17191.
That mark is equivalent to 38.2% of its decline from 8-year-plus highs between 20886 and 20952 early in August last year.
Very nearby lies 17267.5, an important extension of another failed comeback in January/February.
We should also be aware of 17014.8, the highest weekly close this month.
Nikkei’s shorter-term trends do suggest more promising momentum.
It trades above the much-used 21-day exponential moving average (EMA).
The Slow-Stochastic oscillator (sub-chart) points lower, but will retain a positive bias whilst above an uptrend visible since mid-February.
Triangulation comprised of the rising trend since February and failure highs since January completes the picture of consolidation that’s drawing to a close, with a moderate chance of a bullish near-term outcome only if 16901.5 holds.
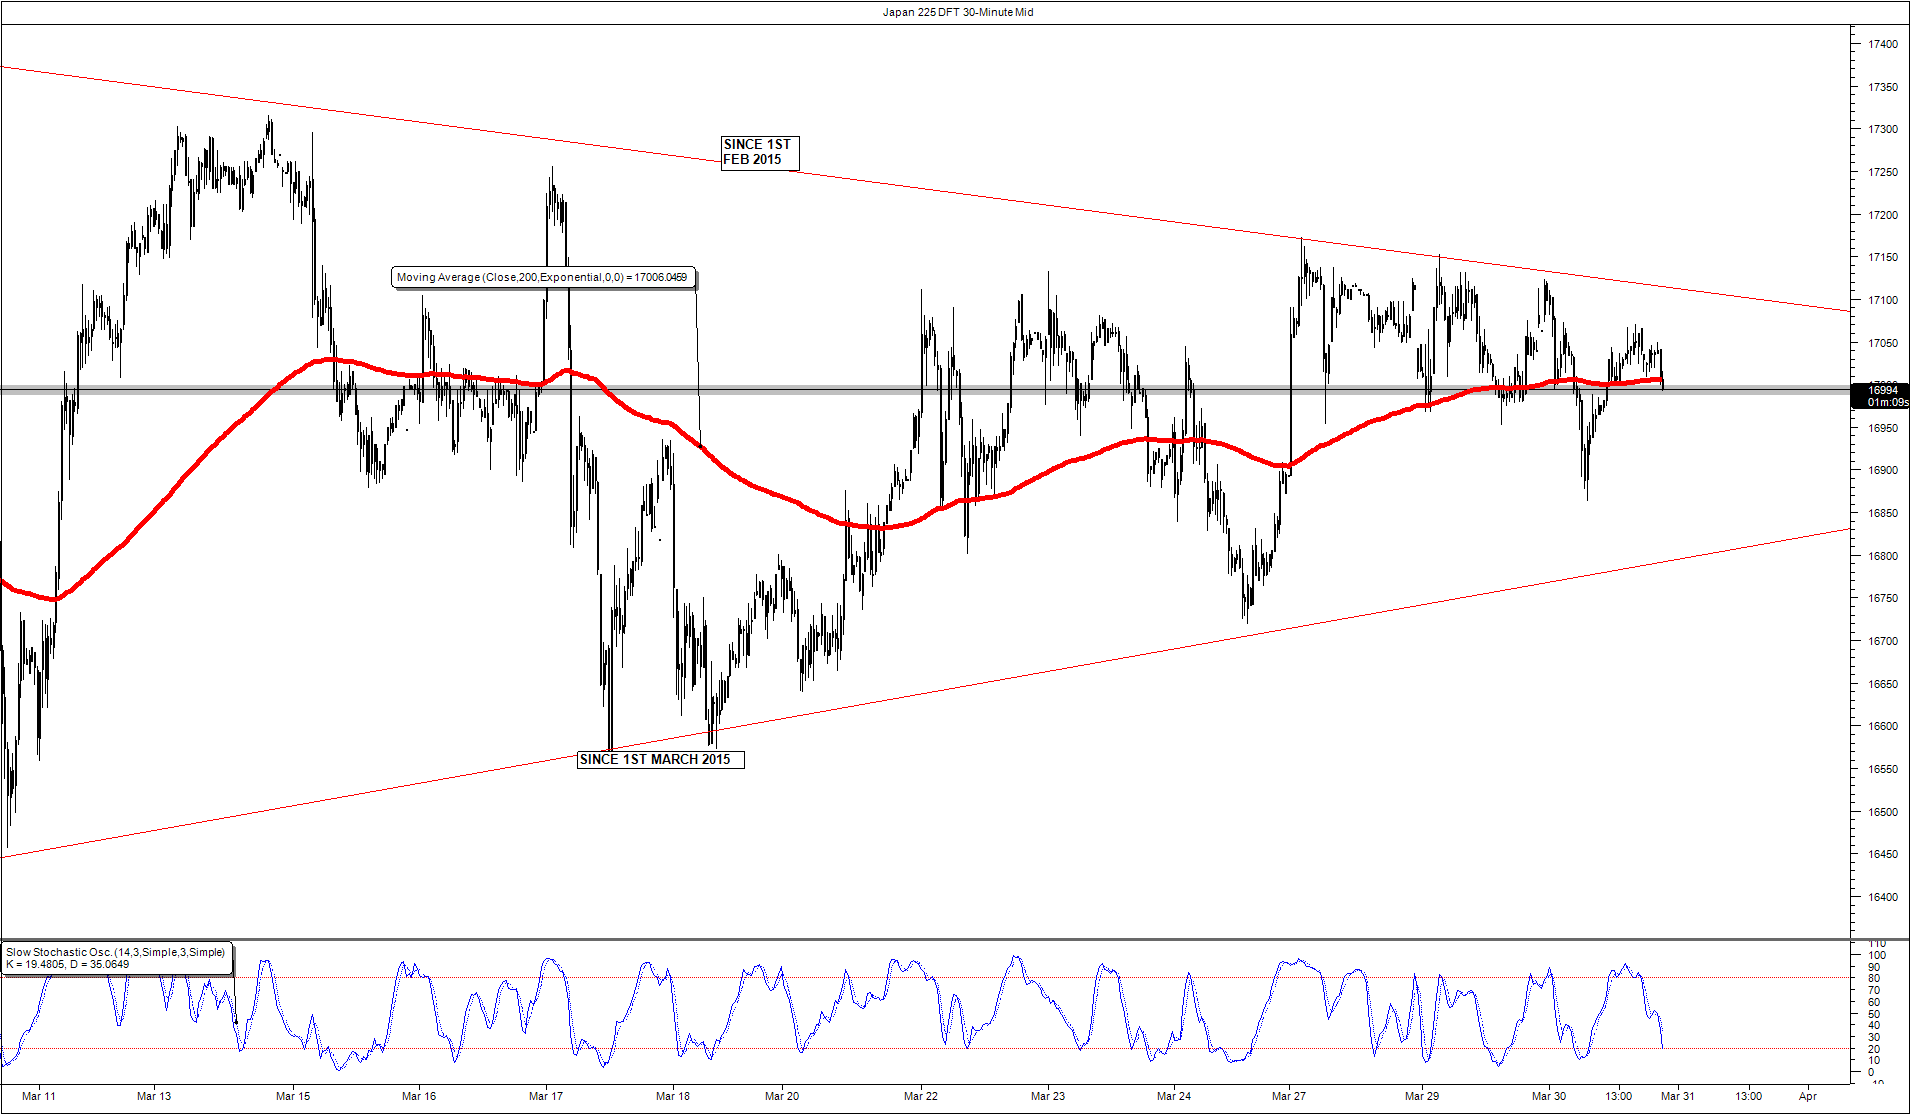
A pincer movement has also been closing in around City Index’s Japan 225 Daily Funded Trade in the half-hourly view.
HALF-HOURLY CHART
Please click image to enlarge
Continued inability to break beyond the descending overhead trend in place since February would be negative, especially if potential weakness in the underlying market is realised.
Japan 225’s higher trend line and one underneath, visible since March, will converge early in April.
Japan 225 bulls will then need to evade the sharp point on the upside.
They will have a chance to do this if Japan 225 is above its red 3-day EMA when the trends meet.
StoneX Financial Ltd (trading as “City Index”) is an execution-only service provider. This material, whether or not it states any opinions, is for general information purposes only and it does not take into account your personal circumstances or objectives. This material has been prepared using the thoughts and opinions of the author and these may change. However, City Index does not plan to provide further updates to any material once published and it is not under any obligation to keep this material up to date. This material is short term in nature and may only relate to facts and circumstances existing at a specific time or day. Nothing in this material is (or should be considered to be) financial, investment, legal, tax or other advice and no reliance should be placed on it.
No opinion given in this material constitutes a recommendation by City Index or the author that any particular investment, security, transaction or investment strategy is suitable for any specific person. The material has not been prepared in accordance with legal requirements designed to promote the independence of investment research. Although City Index is not specifically prevented from dealing before providing this material, City Index does not seek to take advantage of the material prior to its dissemination. This material is not intended for distribution to, or use by, any person in any country or jurisdiction where such distribution or use would be contrary to local law or regulation.
For further details see our full non-independent research disclaimer and quarterly summary.
CFDs are complex instruments and come with a high risk of losing money rapidly due to leverage. 69% of retail investor accounts lose money when trading CFDs with this provider. You should consider whether you understand how CFDs work and whether you can afford to take the high risk of losing your money. CFD and Forex Trading are leveraged products and your capital is at risk. They may not be suitable for everyone. Please ensure you fully understand the risks involved by reading our full risk warning.
City Index is a trading name of StoneX Financial Ltd. Head and Registered Office: 1st Floor, Moor House, 120 London Wall, London, EC2Y 5ET. StoneX Financial Ltd is a company registered in England and Wales, number: 05616586. Authorised and regulated by the Financial Conduct Authority. FCA Register Number: 446717.
City Index is a trademark of StoneX Financial Ltd.
The information on this website is not targeted at the general public of any particular country. It is not intended for distribution to residents in any country where such distribution or use would contravene any local law or regulatory requirement.
© City Index 2024