Nikkei 225 8211 Further upside potential towards 20 080 20 440
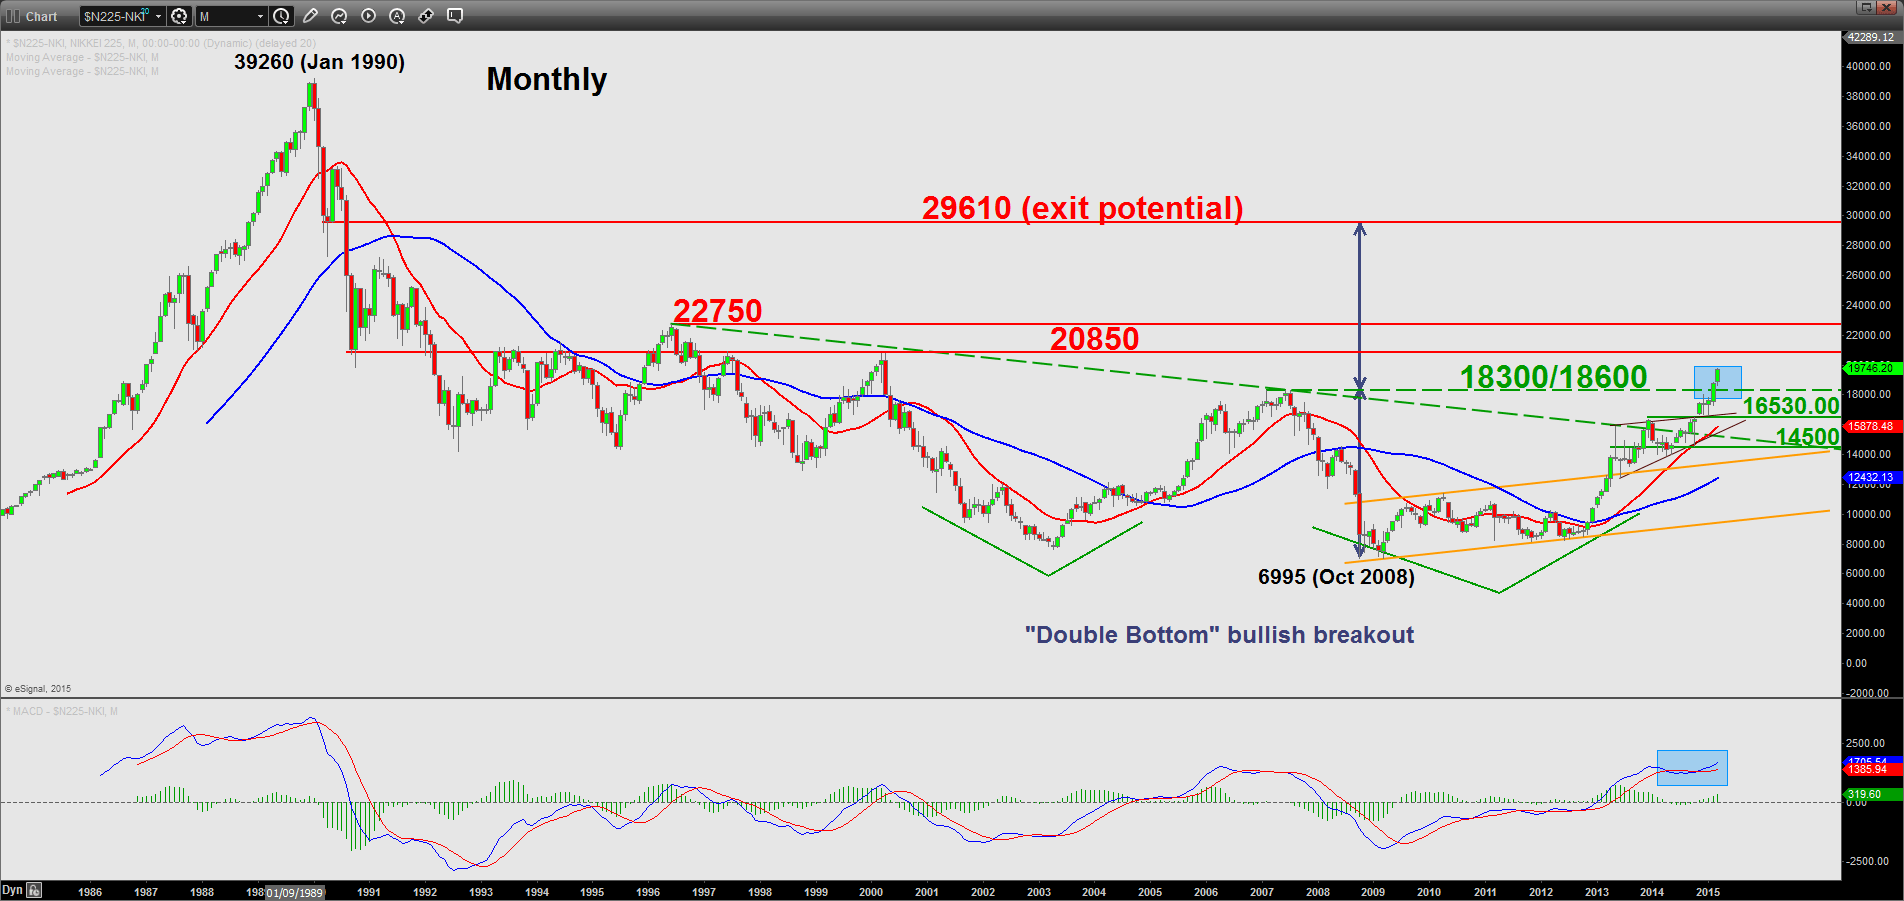
Since the bursting of the Japanese asset (property) price bubble in the early 1990s, the Japanese stock market as represented by the widely-cited benchmark Nikkei 225 has plummeted by a horrendous decline of 80% from a high of 39260 printed on January 1990 to a low of 7606 seen in April 2003.
Even in the previous major bullish trend that occurred from 2003 to 2007 for most emerging and developed markets, Japan was not able to “enjoy the fruits” and underperformed against the rest of the world.
Since the low of 6995 printed in October 2008, the Nikkei 225 has soared by an astonishing 177% to record a high of 18865 seen in February 2015. This remarkable performance is driven primarily by Abenomics.
The big question in all traders’/investors’ minds right now is can this rally be sustainable? Will it falter just like it did after the 2003 to 2007 period?
I will answer this golden question from a technical analysis perspective.
Key elements
- The Index has just broken out of a long-term bullish bottoming formation called “Double Bottom”, in place since April 2003. The exit potential of the “Double Bottom” targets the 29610 level (see monthly chart below).
- The long-term MACD trend indicator has managed to flash a bullish crossover after a “flattish” environment since January 2014. This observation suggests that upside momentum is still supporting the current long-term bullish trend, in place since October 2008 (see monthly chart below).
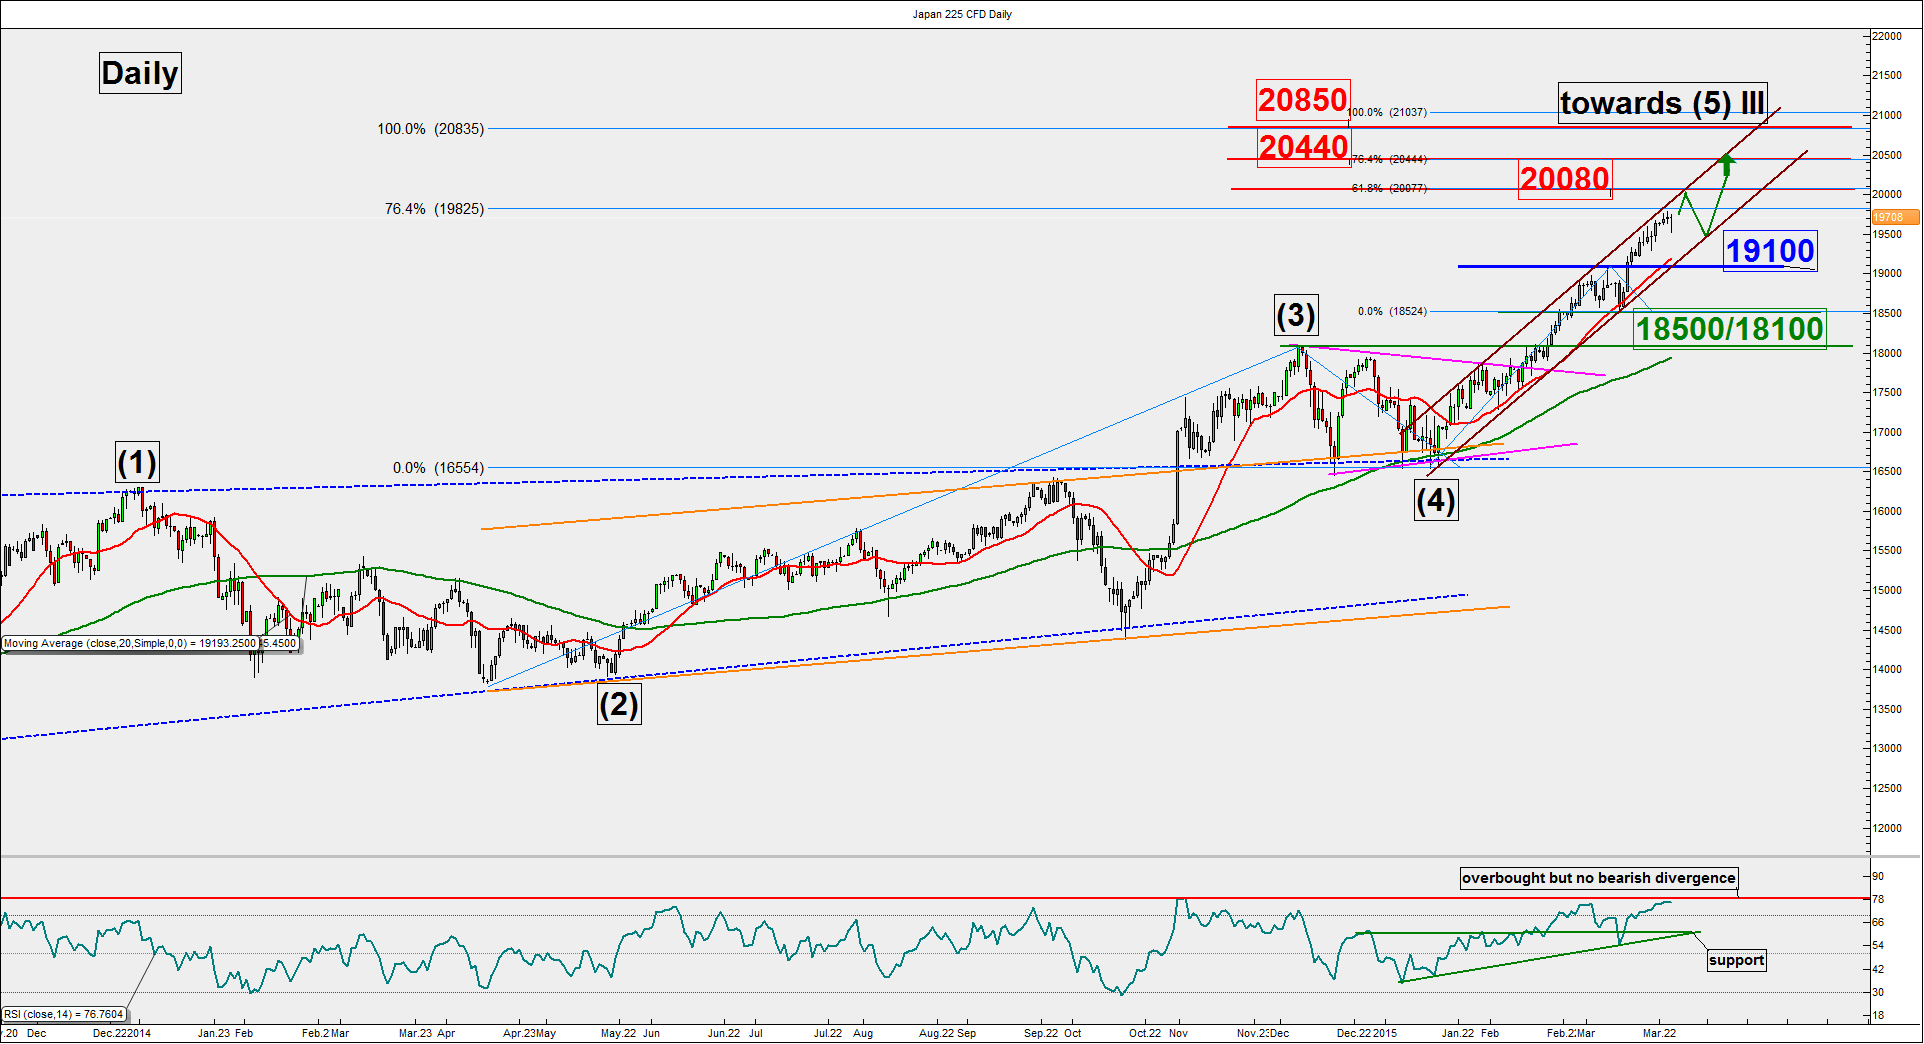
- The lower boundary of the intermediate-term ascending channel (in brown), in place since 14 January 2015, and the upward sloping 20-day Moving Average (in red) are acting as a support at 19100 (see daily chart below).
- The 23.6% Fibonacci retracement from 14 January 2015 low to the current 24 March 2015 high also confluences at the 19100 support.
- The intermediate-term RSI oscillator is overbought but without any bearish divergence (see daily chart below).
- The next resistances at 20080 and 20440 are 0.618 and 0.764 Fibonacci projection levels from 14 January 2015 low to 10 March 2015 low respectively (see daily chart below).
Key levels (1 to 3 months)
Pivot (key support): 19100
Resistance: 20080 & 20440
Next support: 18500/18100
Conclusion
Technical elements remain positive and as long as the 19100 monthly pivotal support holds, the Nikkei 225 is likely to see a further potential upside movement to target 20080 before 20440.
On the other hand, failure to hold above 19100 may damage the intermediate term bullish trend for a deeper decline towards the next support at 18500/18100 (neckline of the “Double Bottom” bullish breakout).
Both charts are from Advantage Trader & eSignal
StoneX Financial Ltd (trading as “City Index”) is an execution-only service provider. This material, whether or not it states any opinions, is for general information purposes only and it does not take into account your personal circumstances or objectives. This material has been prepared using the thoughts and opinions of the author and these may change. However, City Index does not plan to provide further updates to any material once published and it is not under any obligation to keep this material up to date. This material is short term in nature and may only relate to facts and circumstances existing at a specific time or day. Nothing in this material is (or should be considered to be) financial, investment, legal, tax or other advice and no reliance should be placed on it.
No opinion given in this material constitutes a recommendation by City Index or the author that any particular investment, security, transaction or investment strategy is suitable for any specific person. The material has not been prepared in accordance with legal requirements designed to promote the independence of investment research. Although City Index is not specifically prevented from dealing before providing this material, City Index does not seek to take advantage of the material prior to its dissemination. This material is not intended for distribution to, or use by, any person in any country or jurisdiction where such distribution or use would be contrary to local law or regulation.
For further details see our full non-independent research disclaimer and quarterly summary.
CFDs are complex instruments and come with a high risk of losing money rapidly due to leverage. 69% of retail investor accounts lose money when trading CFDs with this provider. You should consider whether you understand how CFDs work and whether you can afford to take the high risk of losing your money. CFD and Forex Trading are leveraged products and your capital is at risk. They may not be suitable for everyone. Please ensure you fully understand the risks involved by reading our full risk warning.
City Index is a trading name of StoneX Financial Ltd. Head and Registered Office: 1st Floor, Moor House, 120 London Wall, London, EC2Y 5ET. StoneX Financial Ltd is a company registered in England and Wales, number: 05616586. Authorised and regulated by the Financial Conduct Authority. FCA Register Number: 446717.
City Index is a trademark of StoneX Financial Ltd.
The information on this website is not targeted at the general public of any particular country. It is not intended for distribution to residents in any country where such distribution or use would contravene any local law or regulatory requirement.
© City Index 2024