NFP USD finds modest support as jobs wages grew more than expected
This month’s jobs report was always going to be a tough one to predict – are they ever easy? But on this occasion it was extremely difficult because the nonfarm payrolls data was released before two of the most reliable leading indicators, the ISM Services and Manufacturing PMIs. Consequently, there was even more uncertainty than usual. That being said, the leading indicators that we did have in hand had still pointed to another decent report: initial unemployment claims were essentially unchanged relative to last month at a historically low level (259K) for the survey week, while Wednesday’s ADP private sector payrolls report had come out in-line with expectations at 200K.
As it turned out, the official jobs report was actually better than expected. It was thus a surprisingly outcome for those who had sold the dollar in advance of the report on the back of Janet Yellen’s dovish remarks from earlier in the week. The headline nonfarm payrolls report showed that a solid 215K jobs were added into the economy in March while the average hourly earnings rose by a good 0.3 per cent on the month. Both figures topped expectations of 205K and 0.2 per cent, respectively. What’s more, the labor force participation rate unexpectedly rose slightly to 63.0 per cent from 62.90 per cent in February. So you would have thought that the jobless rate would also decline. But you would be wrong, because the rate of unemployment actually rose back to 5.0 per cent from 4.9 per cent previously. This was the only disappointing aspect of the jobs report. Still, the report is unlikely to be a game changer and the Fed will most likely wait for further evidence that the economy is on a solid path of growth before thinking about raising rates again.
Indeed, the market’s initial reaction was fairly subdued as the dollar failed to make a decisive comeback against the euro or the yen. Nevertheless it fared better against the pound and the commodity currencies which fell along with buck-denominated metal and oil prices. Equities showed a mixed reaction, moving very little post the data. Global stocks had already been sharply lower as a rallying EUR/USD exchange rate made EU exports less attractive while the falling crude prices had hurt commodity stocks. Looking ahead to the remainder of the day, the ISM services PMI was due for release at 15:00 BST (10:00 ET), followed by the oil rig counts data from Baker Hughes later this evening.
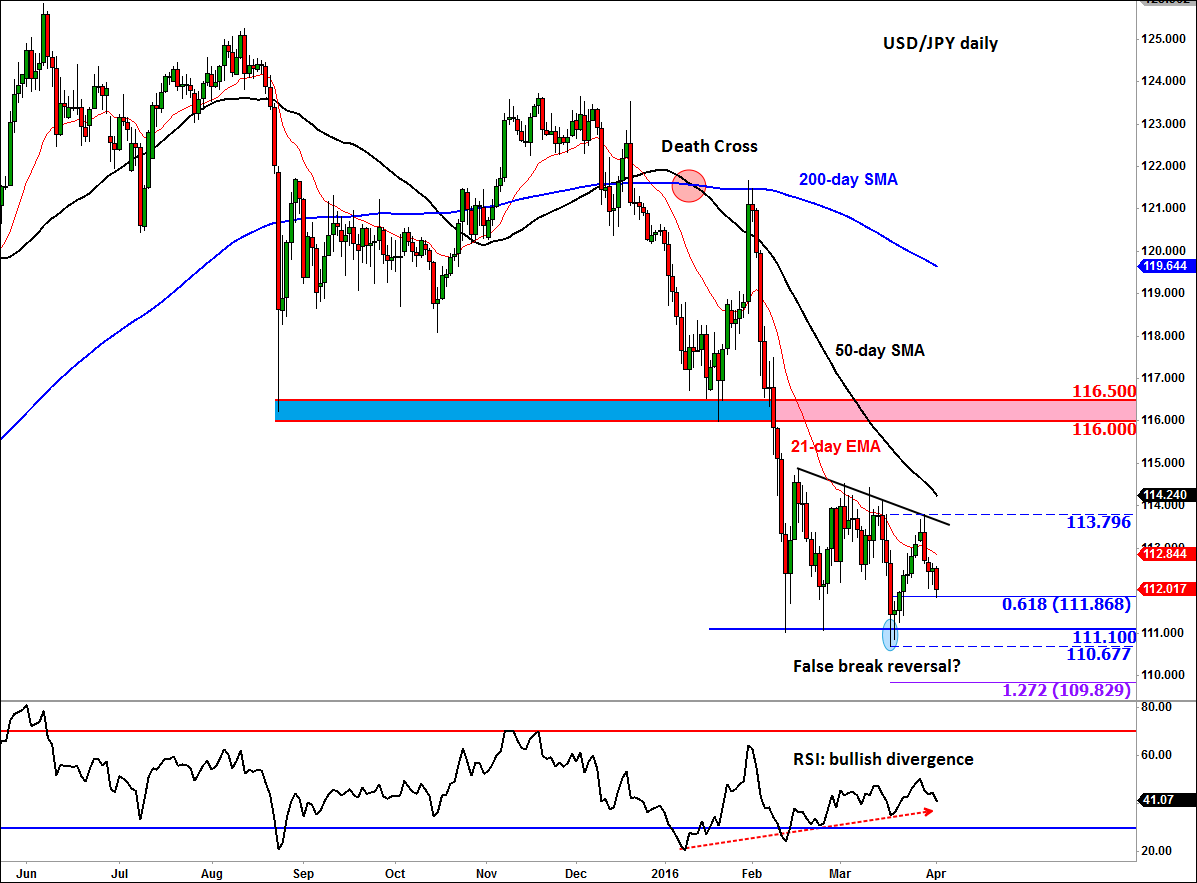
Technical outlook: USD/JPY
The daily chart of the USD/JPY has been making lower lows and lower highs, while the moving averages are all in the wrong order. So the trend is clearly bearish as things stand. However, there is a small possibility that it may have carved out a short-term bottom in the middle of last month when it failed to break through the prior low around the 111.00/111.10 area. The false break there suggests the sellers lacked conviction to sell the USD against JPY, perhaps because they were waiting for some fundamental stimulus or may be because the RSI was in a state of bullish divergence. Since then, Janet Yellen has spoken along with several other FOMC colleagues, mostly delivering dovish comments. Yet, the USD/JPY has refused to penetrate that key support level. And while today’s US jobs report may not be a game changer, the fact that it has topped expectations may suggest that the buyers will step in at a support level such as the 61.8% Fibonacci retracement of the bounce from the March low, at 111.85/7 and defend their ground. While the 111.00/111.10 area holds as support, the bias would remain neutral. A potential break below this level on a daily closing basis however would end any bullish hopes, while a break above the short-term bearish trend line would be deemed a bullish development. The longer-term outlook remains bearish for as long as the USD/JPY holds below the 116.00/50 area – or unless it posts a clear reversal pattern on its charts elsewhere. Trade the USD/JPY cautiously while the trend is uncertain.
StoneX Financial Ltd (trading as “City Index”) is an execution-only service provider. This material, whether or not it states any opinions, is for general information purposes only and it does not take into account your personal circumstances or objectives. This material has been prepared using the thoughts and opinions of the author and these may change. However, City Index does not plan to provide further updates to any material once published and it is not under any obligation to keep this material up to date. This material is short term in nature and may only relate to facts and circumstances existing at a specific time or day. Nothing in this material is (or should be considered to be) financial, investment, legal, tax or other advice and no reliance should be placed on it.
No opinion given in this material constitutes a recommendation by City Index or the author that any particular investment, security, transaction or investment strategy is suitable for any specific person. The material has not been prepared in accordance with legal requirements designed to promote the independence of investment research. Although City Index is not specifically prevented from dealing before providing this material, City Index does not seek to take advantage of the material prior to its dissemination. This material is not intended for distribution to, or use by, any person in any country or jurisdiction where such distribution or use would be contrary to local law or regulation.
For further details see our full non-independent research disclaimer and quarterly summary.
CFDs are complex instruments and come with a high risk of losing money rapidly due to leverage. 69% of retail investor accounts lose money when trading CFDs with this provider. You should consider whether you understand how CFDs work and whether you can afford to take the high risk of losing your money. CFD and Forex Trading are leveraged products and your capital is at risk. They may not be suitable for everyone. Please ensure you fully understand the risks involved by reading our full risk warning.
City Index is a trading name of StoneX Financial Ltd. Head and Registered Office: 1st Floor, Moor House, 120 London Wall, London, EC2Y 5ET. StoneX Financial Ltd is a company registered in England and Wales, number: 05616586. Authorised and regulated by the Financial Conduct Authority. FCA Register Number: 446717.
City Index is a trademark of StoneX Financial Ltd.
The information on this website is not targeted at the general public of any particular country. It is not intended for distribution to residents in any country where such distribution or use would contravene any local law or regulatory requirement.
© City Index 2024