Nasdaq bounce shoves aside value comeback
What goes around….often just keeps going: ‘value’ bounce may be fading already
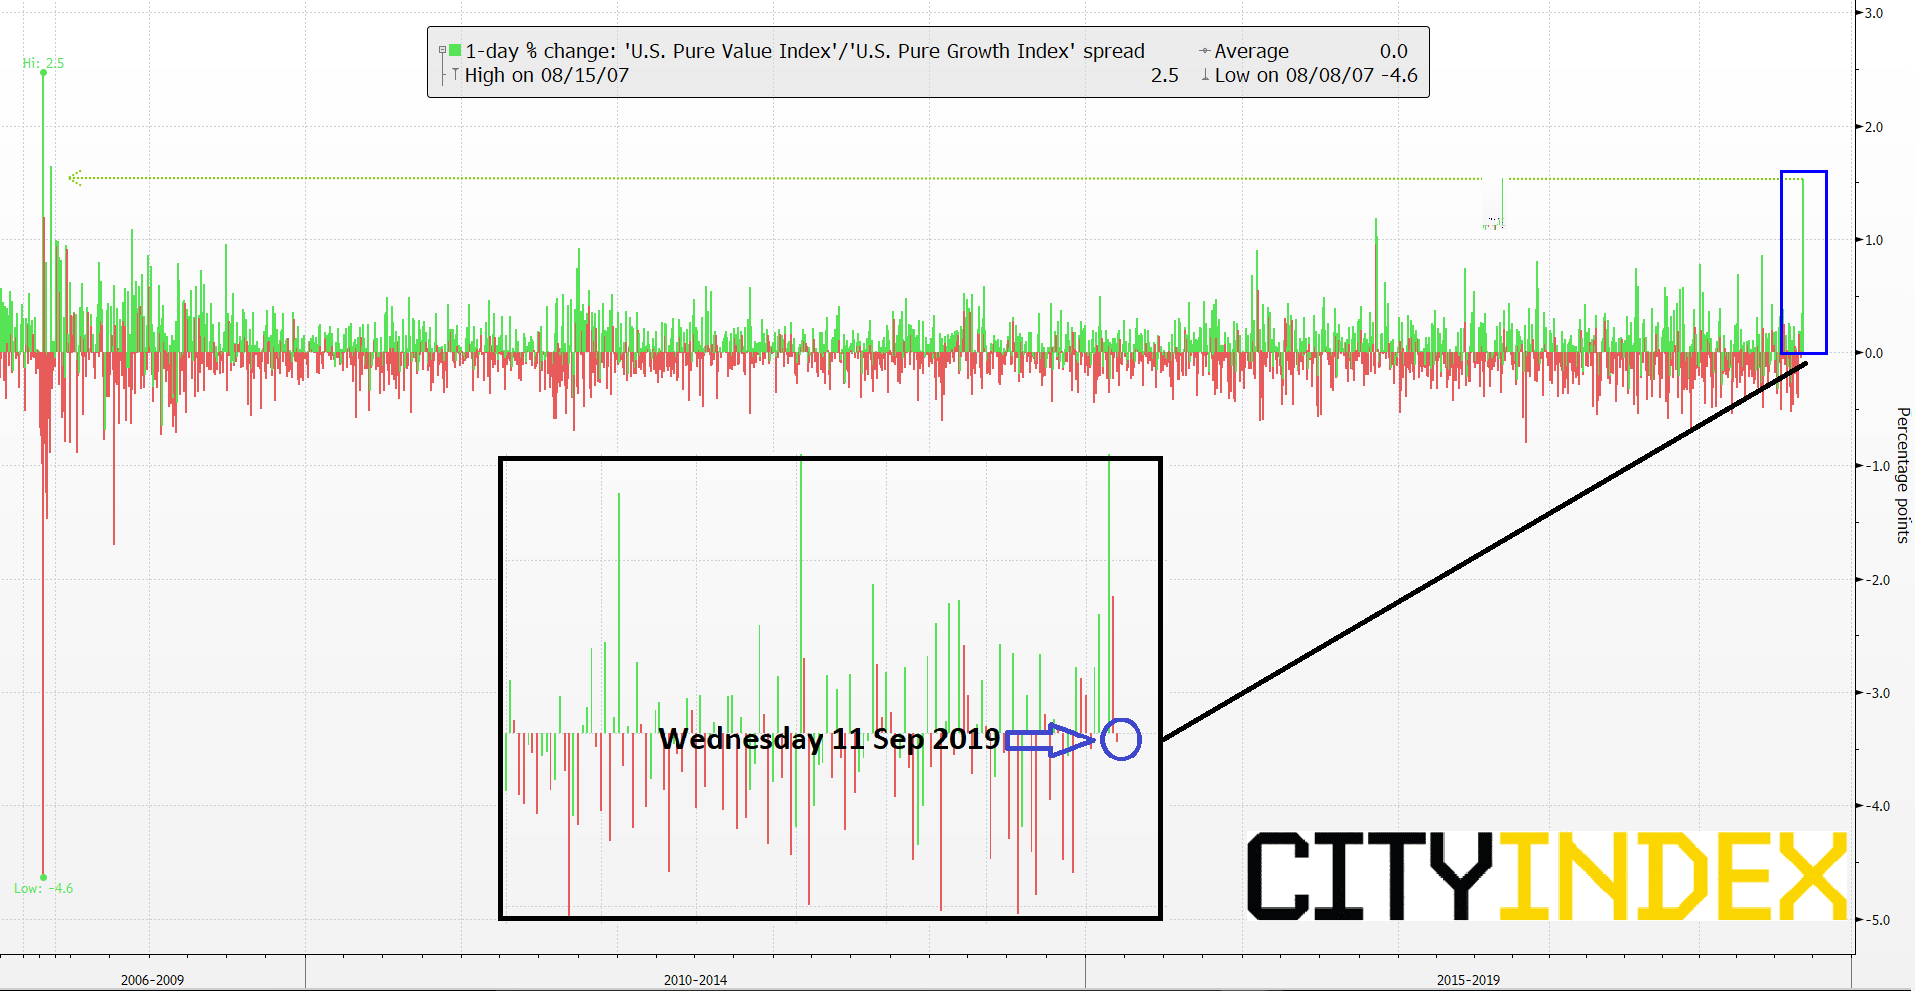
Indications so far from Wednesday’s U.S. stock trading session suggest that the move to favour cheaper, higher-yielding shares over long-standing 'momentum' outperformers, may be fizzling out already. Despite lacklustre sessions earlier this week, which saw the S&P 500 index close flat on Monday, Wall Street has been awash with talk over a sharp swing—known as a ‘rotation’—away from one set of equity market sector preferences in favour of another. The move back to ‘value’ shares from ‘momentum’ stocks was the fiercest over one trading day, according to data gathered by Bloomberg. The chart below shows daily percentage changes of the spread between Bloomberg’s ‘U.S Pure Value Index’ and ‘U.S. Pure Growth Index’.
‘Momentum’ is typified by techy consumer growth names like Amazon, Facebook and Netflix which continue to sit on triple percentage digit price returns over several years. Banks, insurance firms, makers of capital goods, telecoms and other industrial segments often populate the ‘value’ sphere. What appeared to be the beginnings of a value comeback boosted stocks in many industries that have struggled over the last few years. On Tuesday, this created a sea of green that included all but one S&P 500 bank (the exception was Wells Fargo) also boosting struggling retailer JCPenney above its consensus target price for the first time in several weeks, amid apparently no company specific news.
Absolute change chart: ‘U.S. Pure Value Index’ / ‘U.S. Pure Growth Index’ spread – Daily
Source: Bloomberg /City Index
By Wednesday, the same measures show ‘value’ slumping back sharply. That may not be much of a surprise given the outsize move in the opposite direction earlier in the week. Part of the swing is associated with this week’s resounding government bond market correction as the multi-month rally in developed market bonds and beyond shows signs of fraying. The idea that links a bond correction to a possible swing to value is that if the bond rally may soon peter out, investors might be switching back from chasing absolute bond price gains and returning to yield seeking in shares. With Treasury yields looking less sure-footed into the U.S. cash open though—yields were 1.4 basis points (bp) to 3.2bp lower across the curve—enthusiasm about a switch back to ‘value’ is lower too.
As for whether this week’s events may mark a lasting turn in investors’ prevailing preference, the jury’s out. If bonds (which move inversely to yields) continue rallying on the back of redoubled Fed easing hopes, value may continue to struggle. But what if recession fears bed down deeply enough to trigger a lasting move to the relative safety of ‘value’ stocks against preferences for shares related to other styles, like ‘momentum’, but also ‘volatility’ and others? In that case, eye-catching swings we’ve seen this week could pave the way for lasting changes among stock market leadership.
Chart thoughts
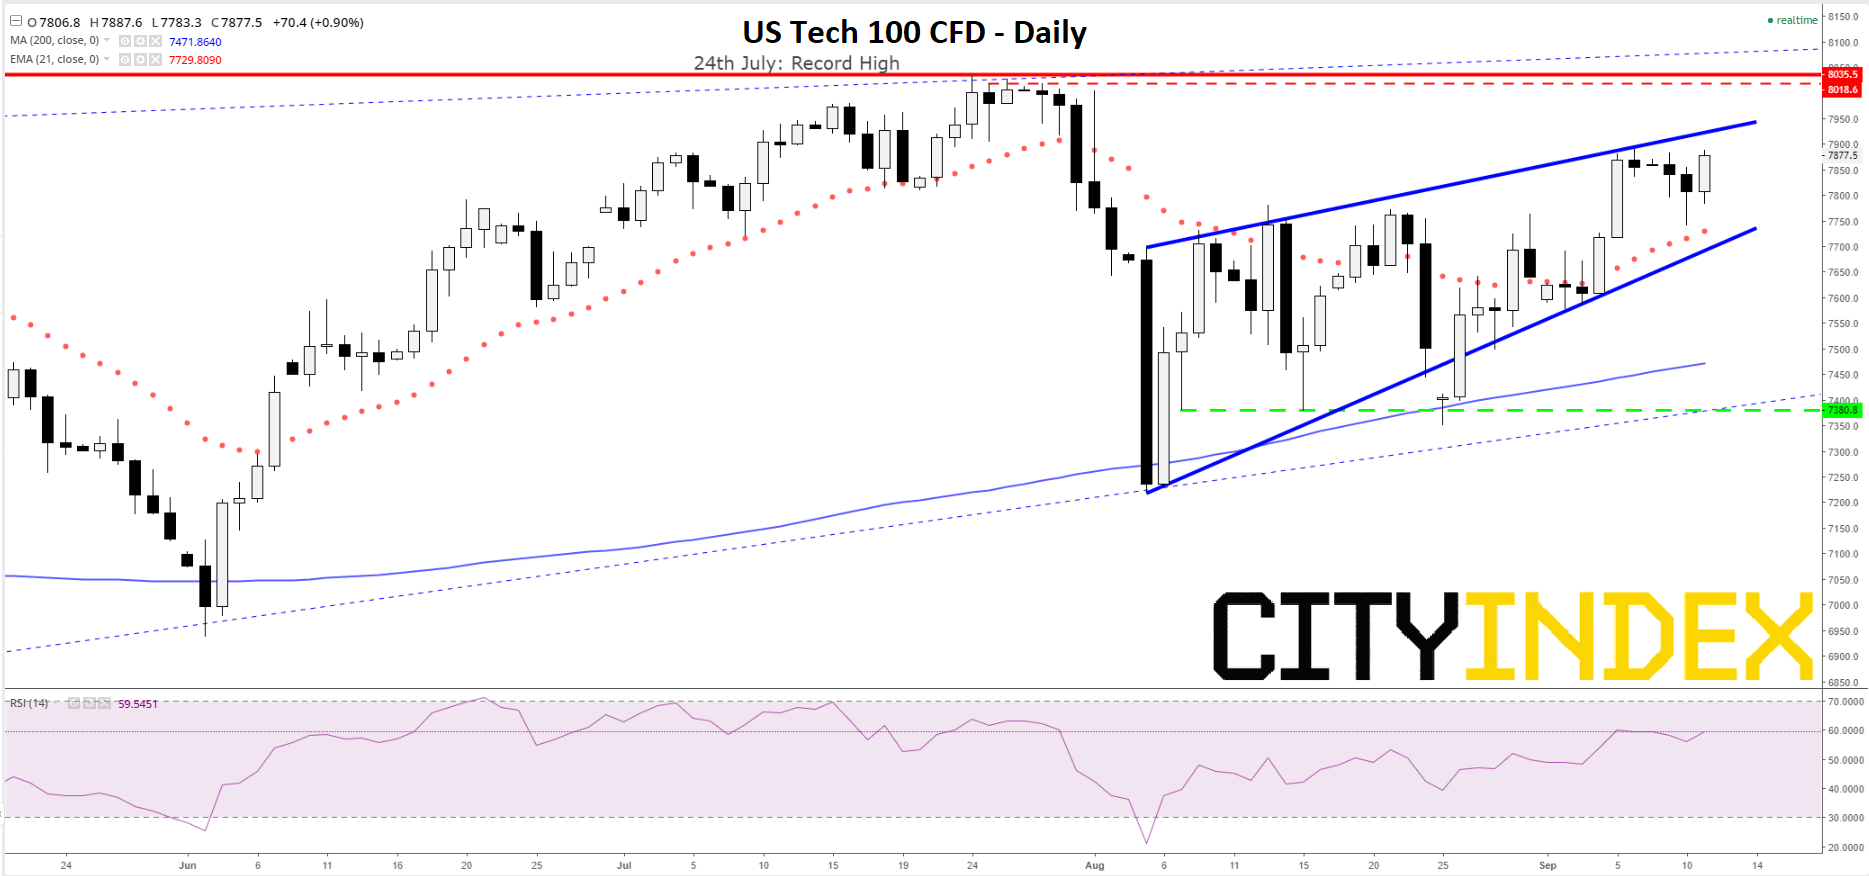
The technology-stock heavy (and thus ‘momentum’ / ‘growth’-sensitive) Nasdaq 100 index is the most relevant backdrop as the eternal battle between those styles comes to a head again. The US Tech 100 CFD proxy shows the market is in a long, slow coil as it hovers close to July’s latest record peak. Closing in, the market’s recovery from August’s mini-correction remains valid, particularly judged from coherence of another ‘coil’ or wedge, forming over several weeks. As it stands, its hypothetical effect is that it will keep funnelling prices higher so long as there are no sustained moves to the downside of the pattern. As prices ascend, the first significant impediments are a moderate distance away. 8018, was the high on the day after July’s record and the best the market could do on its only down day that week. The peak itself was 8035. Even if a ‘value’ takeover really has begun, a bullish-looking Nasdaq chart suggests the shift will be a gradual rather than sudden one, if at all. Even then, true confirmation would still need to wait for 1. A further Nasdaq 100 failure at this year’s top so far, and 2. A clean break of the nearest proven major support, 7308, followed by inarguable follow-through.
US Tech 100 CFD – Daily
Source: City Index
StoneX Financial Ltd (trading as “City Index”) is an execution-only service provider. This material, whether or not it states any opinions, is for general information purposes only and it does not take into account your personal circumstances or objectives. This material has been prepared using the thoughts and opinions of the author and these may change. However, City Index does not plan to provide further updates to any material once published and it is not under any obligation to keep this material up to date. This material is short term in nature and may only relate to facts and circumstances existing at a specific time or day. Nothing in this material is (or should be considered to be) financial, investment, legal, tax or other advice and no reliance should be placed on it.
No opinion given in this material constitutes a recommendation by City Index or the author that any particular investment, security, transaction or investment strategy is suitable for any specific person. The material has not been prepared in accordance with legal requirements designed to promote the independence of investment research. Although City Index is not specifically prevented from dealing before providing this material, City Index does not seek to take advantage of the material prior to its dissemination. This material is not intended for distribution to, or use by, any person in any country or jurisdiction where such distribution or use would be contrary to local law or regulation.
For further details see our full non-independent research disclaimer and quarterly summary.
CFDs are complex instruments and come with a high risk of losing money rapidly due to leverage. 69% of retail investor accounts lose money when trading CFDs with this provider. You should consider whether you understand how CFDs work and whether you can afford to take the high risk of losing your money. CFD and Forex Trading are leveraged products and your capital is at risk. They may not be suitable for everyone. Please ensure you fully understand the risks involved by reading our full risk warning.
City Index is a trading name of StoneX Financial Ltd. Head and Registered Office: 1st Floor, Moor House, 120 London Wall, London, EC2Y 5ET. StoneX Financial Ltd is a company registered in England and Wales, number: 05616586. Authorised and regulated by the Financial Conduct Authority. FCA Register Number: 446717.
City Index is a trademark of StoneX Financial Ltd.
The information on this website is not targeted at the general public of any particular country. It is not intended for distribution to residents in any country where such distribution or use would contravene any local law or regulatory requirement.
© City Index 2024