Nasdaq 100 Impulsive up move likely resuming supported by Fed
Medium-term technical outlook on Nasdaq 100 (US Tech 100)
click to enlarge charts
Key Levels (1 to 3 weeks)
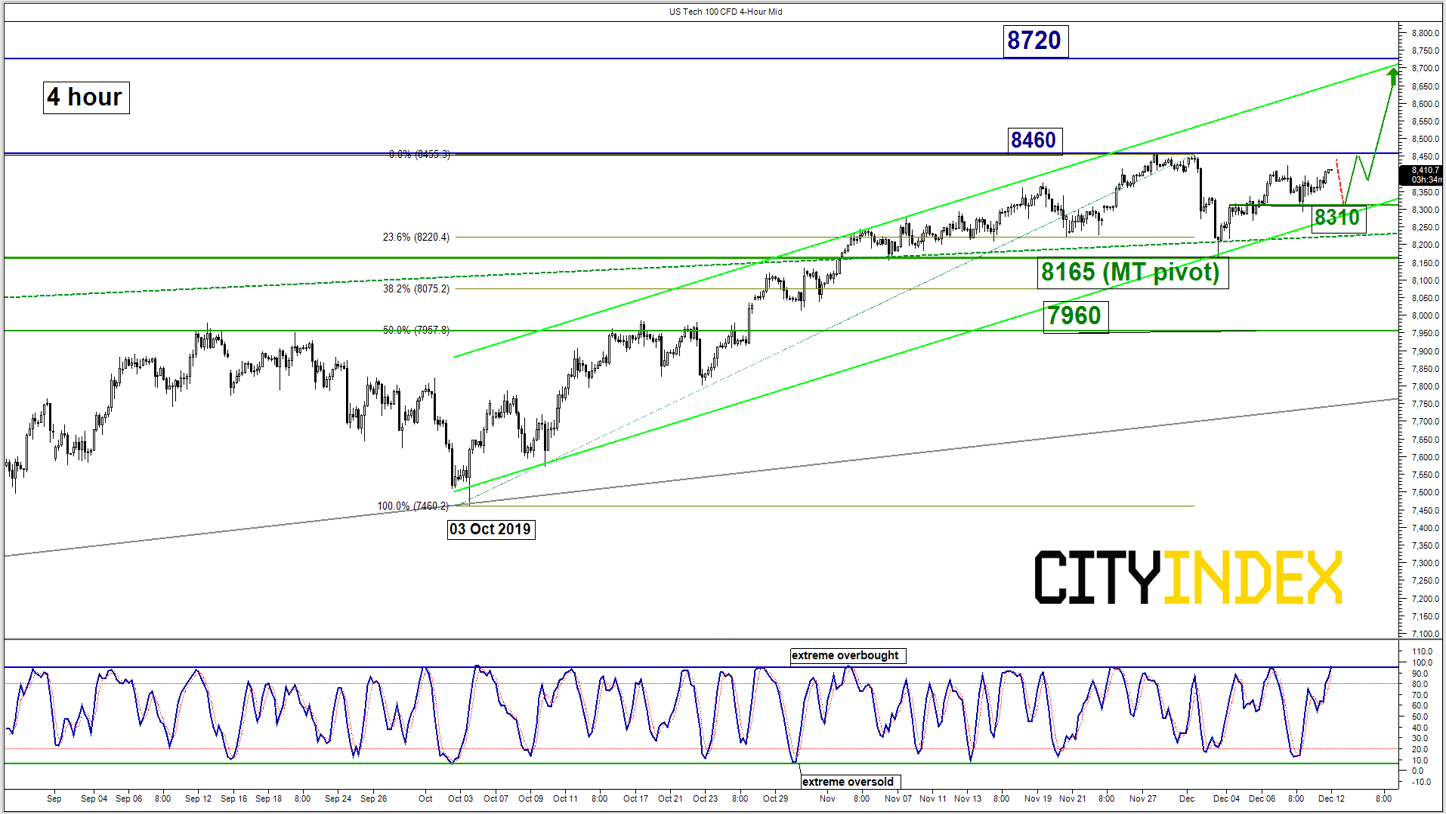
Intermediate support: 8310
Pivot (key support): 8165
Resistances: 8460 & 8720
Next support: 7960
Directional Bias (1 to 3 weeks)
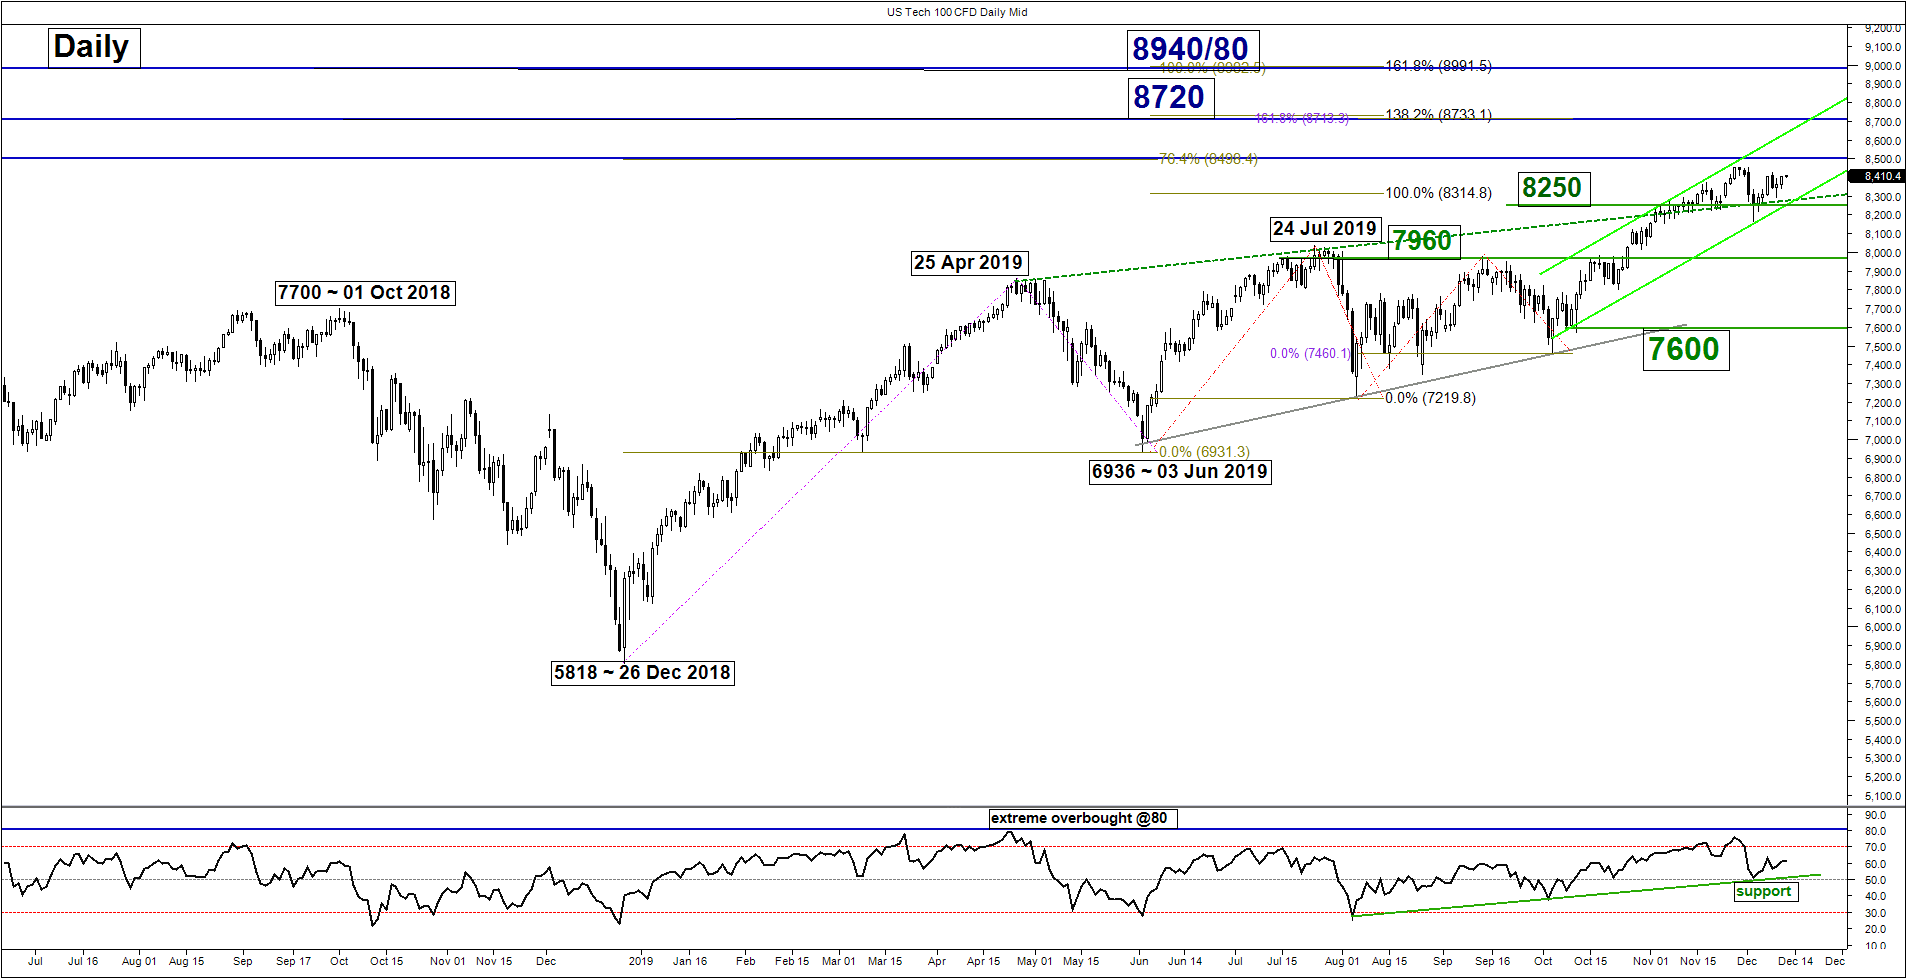
In our previous report on the US Tech 100 (proxy for Nasdaq 100 futures) dated on 04 Dec 2019, our view was a corrective pull-back first towards 8075/8000 before the another upleg unfolds. The Index had fared much better than our expectation, it printed a low of 8165 on 03 Dec and started to turn higher and almost erased all its losses from the previous slide from the 8454 current all-time high printed on 27 Nov to 03 Dec 2019 low.
Latest price action has reduced the conviction for the corrective decline and we flip to a bullish bias in any dips above 8165 key medium-term pivotal support for retest om 8454/8460 current all-time high area before targeting the next resistance at 8720.
On the other hand, a break with a daily close below 8165 revives the deeper corrective decline scenario to retest 7960 (former medium-term range resistance from 24 Jul/12 Sep 2019 & 50% Fibonacci retracement of the up move from 03 Oct low to 27 Nov 2019 high).
Key elements
- The recent slide seen in the Index from 8454 current all-time high to 8165 low of 03 Dec 2019 has stalled right at pull-back support of the former ascending wedge resistance from 25 Apr 2019 high, lower boundary of a medium-term ascending channel from 03 Oct 2019 low and the 23.6% Fibonacci retracement of the on-going up move from 03 Oct low to 27 Nov 2019 high).
- The daily RSI oscillator has also staged a rebound from a significant corresponding ascending support at the 50 level. These observations suggest a revival of medium-term upside momentum.
- The 8720 resistance is defined by the upper boundary of the medium-term ascending channel from 03 Oct 2019 low and a Fibonacci expansion cluster.
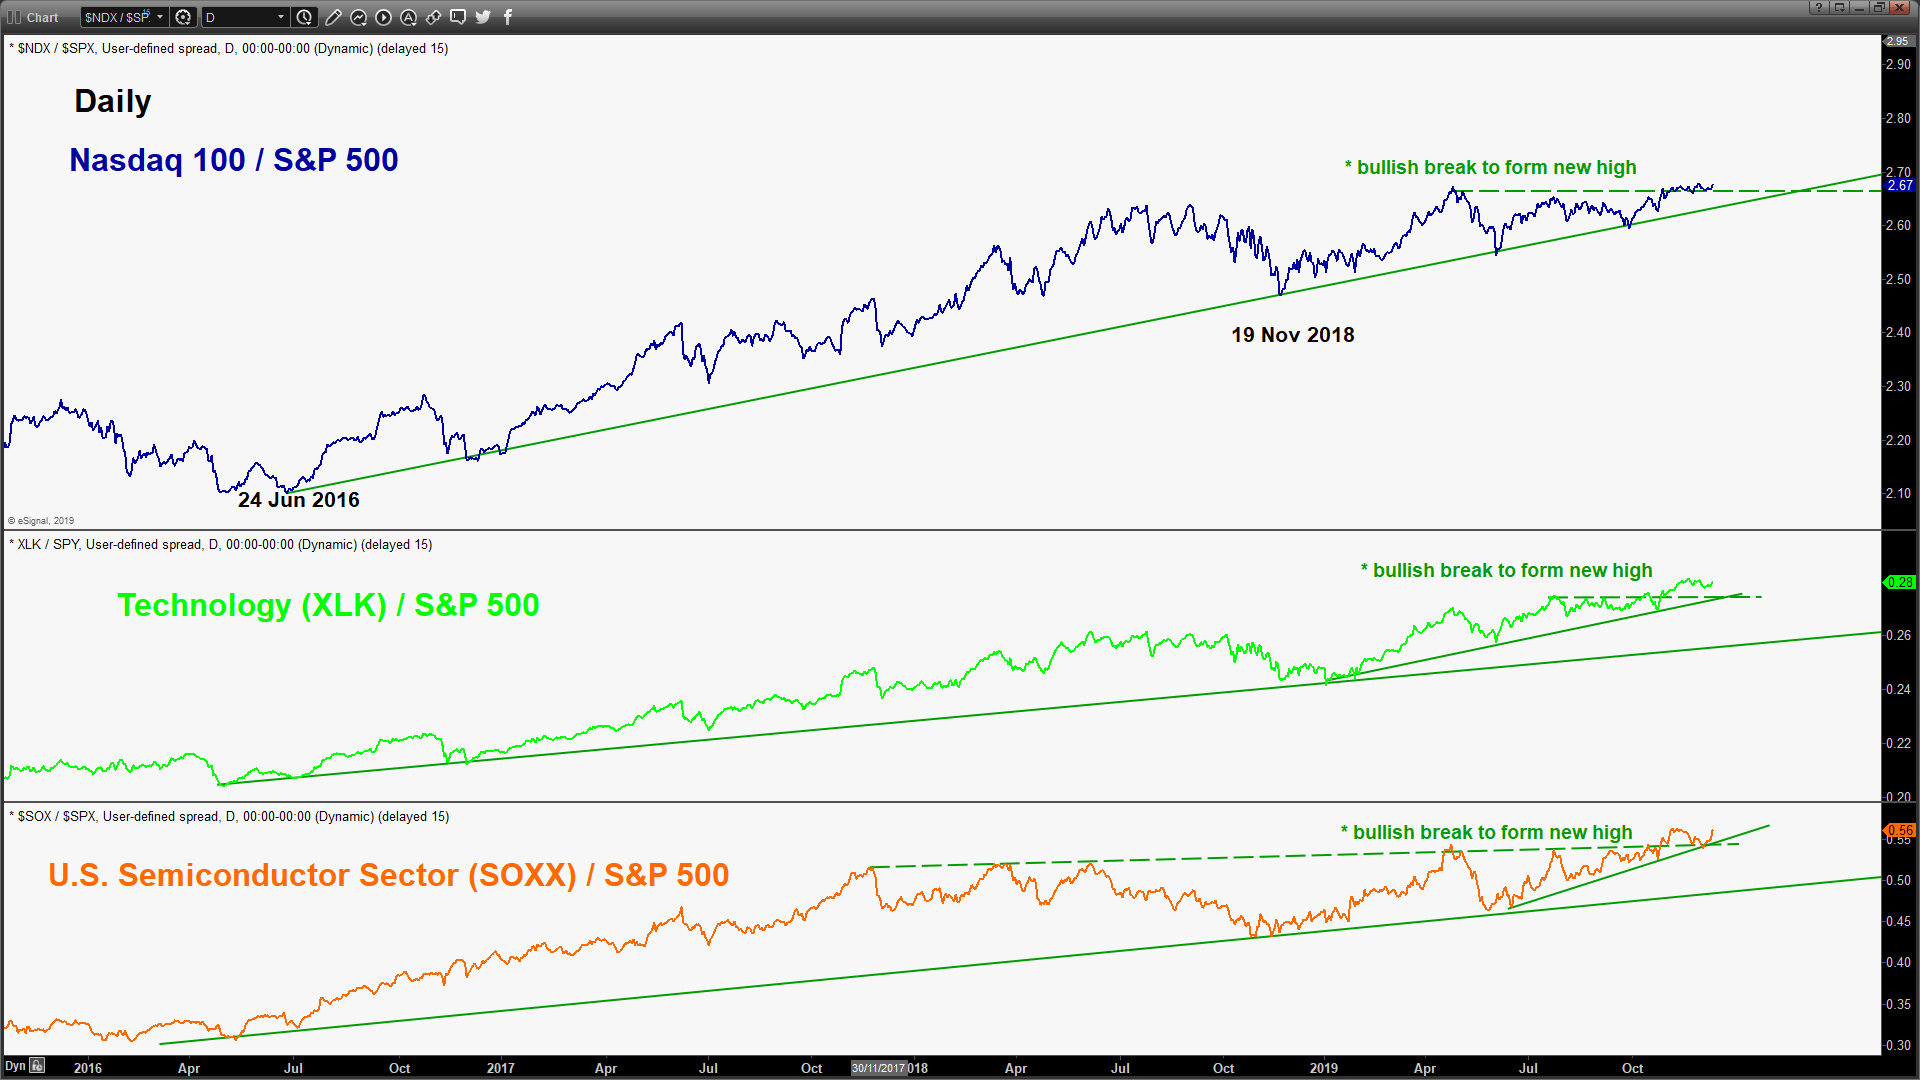
- Relative strength analysis from the ratio charts of Nasdaq 100 and the high beta Technology and Semiconductor sectors against the broader market index (S&P 500) is advocating outperformance of Nasdaq 100 and technology related stocks which has been reinforced by the U.S central bank, the Fed’s desire to keep its key interest rate on hold through 2020 after three cuts to bring down the fed rate to 1.5%-1.75% as indicated from its latest FOMC meeting outcome yesterday.
- A continuation of leadership seen in Nasdaq 100 and technology related stocks is likely to sustain the on-going medium-term uptrend of the U.S. stock market.
Charts are from City Index Advantage TraderPro & eSignal
StoneX Financial Ltd (trading as “City Index”) is an execution-only service provider. This material, whether or not it states any opinions, is for general information purposes only and it does not take into account your personal circumstances or objectives. This material has been prepared using the thoughts and opinions of the author and these may change. However, City Index does not plan to provide further updates to any material once published and it is not under any obligation to keep this material up to date. This material is short term in nature and may only relate to facts and circumstances existing at a specific time or day. Nothing in this material is (or should be considered to be) financial, investment, legal, tax or other advice and no reliance should be placed on it.
No opinion given in this material constitutes a recommendation by City Index or the author that any particular investment, security, transaction or investment strategy is suitable for any specific person. The material has not been prepared in accordance with legal requirements designed to promote the independence of investment research. Although City Index is not specifically prevented from dealing before providing this material, City Index does not seek to take advantage of the material prior to its dissemination. This material is not intended for distribution to, or use by, any person in any country or jurisdiction where such distribution or use would be contrary to local law or regulation.
For further details see our full non-independent research disclaimer and quarterly summary.
CFDs are complex instruments and come with a high risk of losing money rapidly due to leverage. 69% of retail investor accounts lose money when trading CFDs with this provider. You should consider whether you understand how CFDs work and whether you can afford to take the high risk of losing your money. CFD and Forex Trading are leveraged products and your capital is at risk. They may not be suitable for everyone. Please ensure you fully understand the risks involved by reading our full risk warning.
City Index is a trading name of StoneX Financial Ltd. Head and Registered Office: 1st Floor, Moor House, 120 London Wall, London, EC2Y 5ET. StoneX Financial Ltd is a company registered in England and Wales, number: 05616586. Authorised and regulated by the Financial Conduct Authority. FCA Register Number: 446717.
City Index is a trademark of StoneX Financial Ltd.
The information on this website is not targeted at the general public of any particular country. It is not intended for distribution to residents in any country where such distribution or use would contravene any local law or regulatory requirement.
© City Index 2024