Nasdaq 100 A Reset For The Bulls
Medium-term technical outlook on Nasdaq 100 (US Tech 100)
click to enlarge charts
Key Levels (1 to 3 weeks)
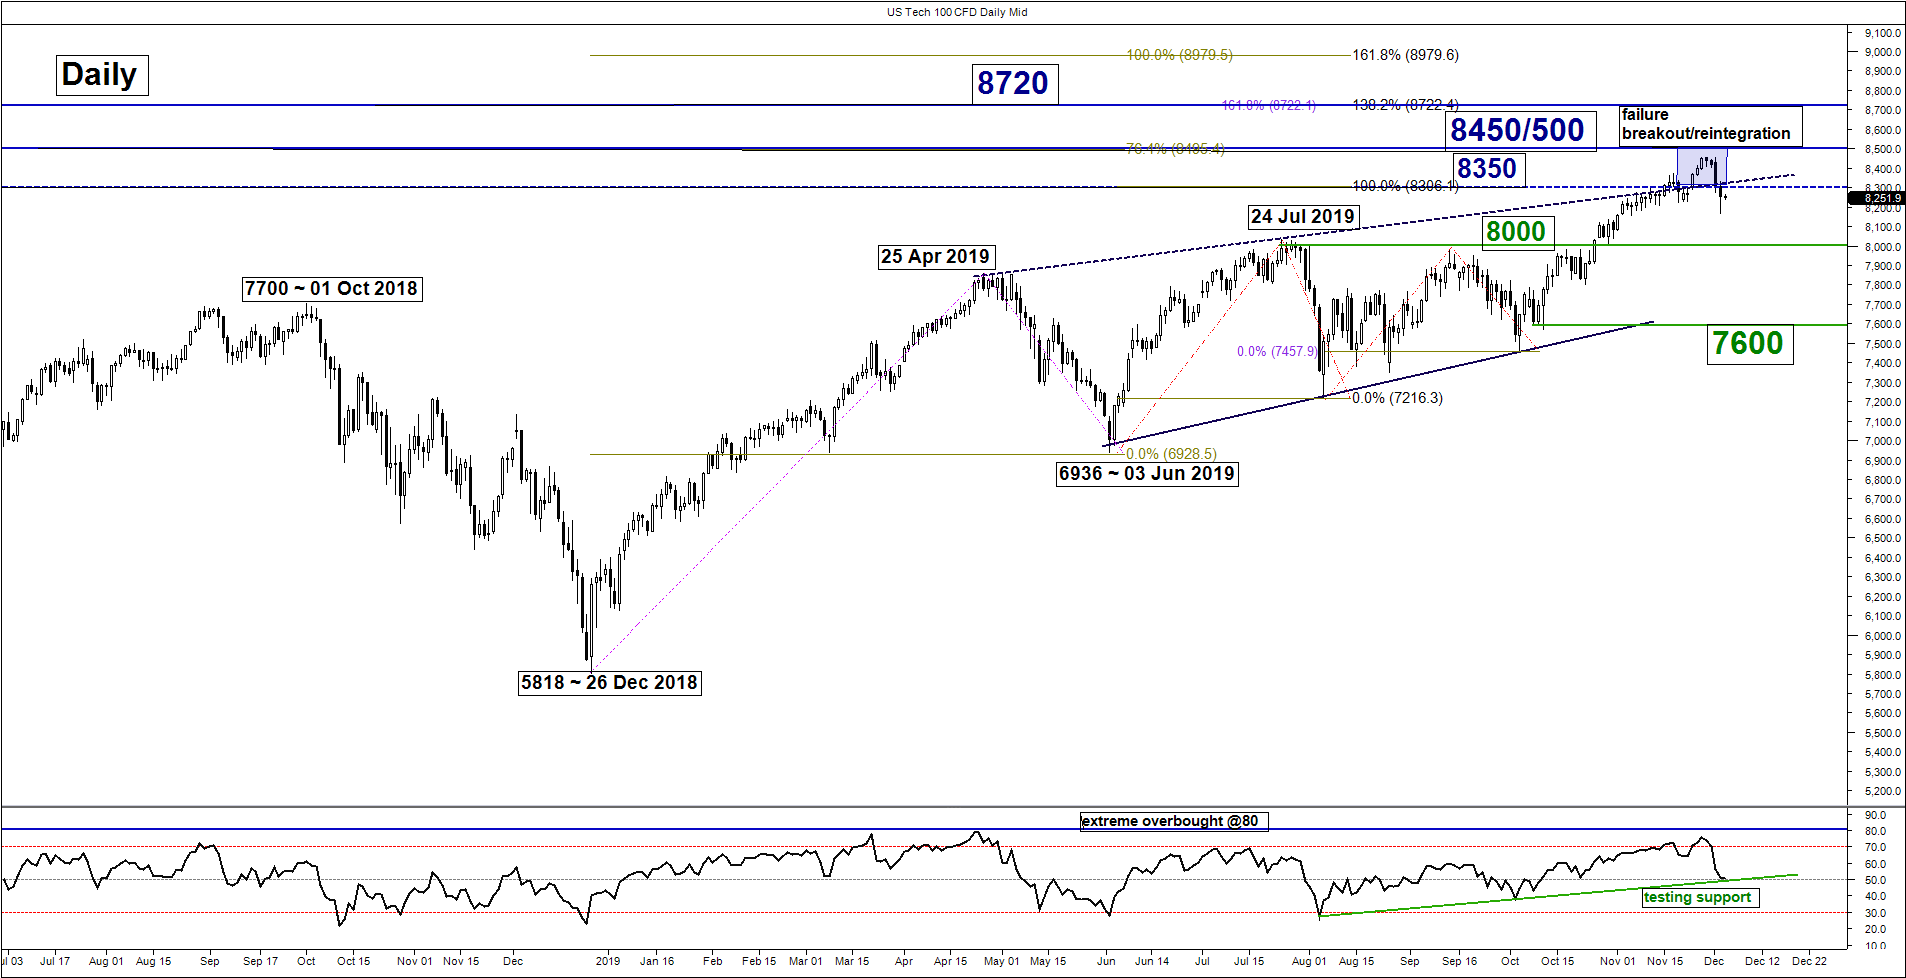
Intermediate resistance: 8350
Pivot (key resistance): 8450/500
Supports: 8075/8000
Next resistance 8720
Directional Bias (1 to 3 weeks)
The US Tech 100 (proxy for Nasdaq 100 futures) has started to roll over in the past two days with a slide of 3.4% from its current all-time of 8454 printed in 27 Nov 2019 reinforced by the latest protectionism aka “Tariff Man” stance’s from U.S. President Trump and a tic for tact retaliation measure from China that may publish a list of “unreliable entities” that can lead to sanctions against U.S. companies in order to “punish” U.S Congress from interfering in China’s sovereign affairs over human rights disputes in Hong Kong and Xinjiang.
Bearish bias in any bounces below 8450/500 key medium-term pivotal resistance for a potential multi-week corrective down move to target the 8075/8000 support before another likely impulsive up move sequence unfolds.
On the other hand, a clearance with a daily close above 8500 continues the relentless uptrend to towards the next resistance at 8720 (Fibonacci expansion cluster).
Key elements
- The last 2 days of down move seen in the US Tech 100 Index has almost wiped out the 50% of the gains recorded in Nov and reintegrated by below the upper boundary of the “Ascending Wedge” from 25 Apr 2019 high now turns pull-back resistance at 8350.
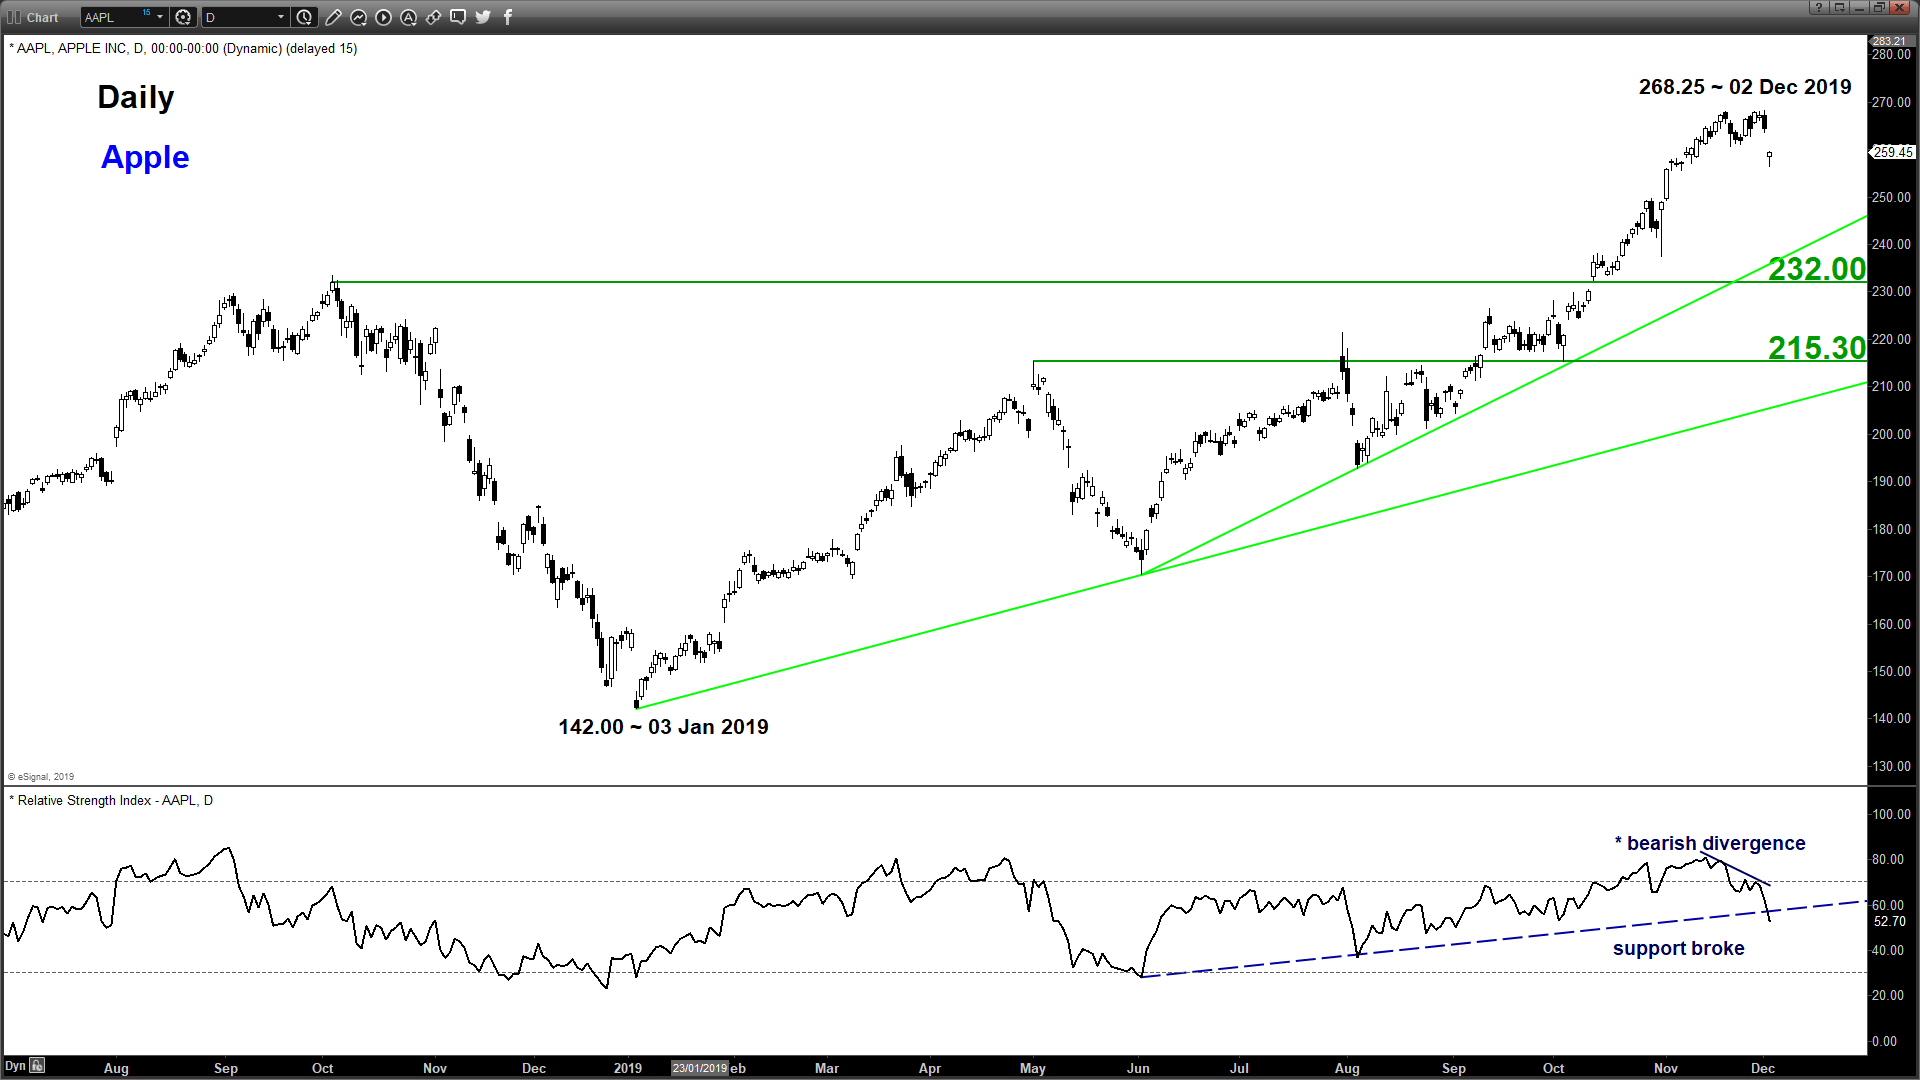
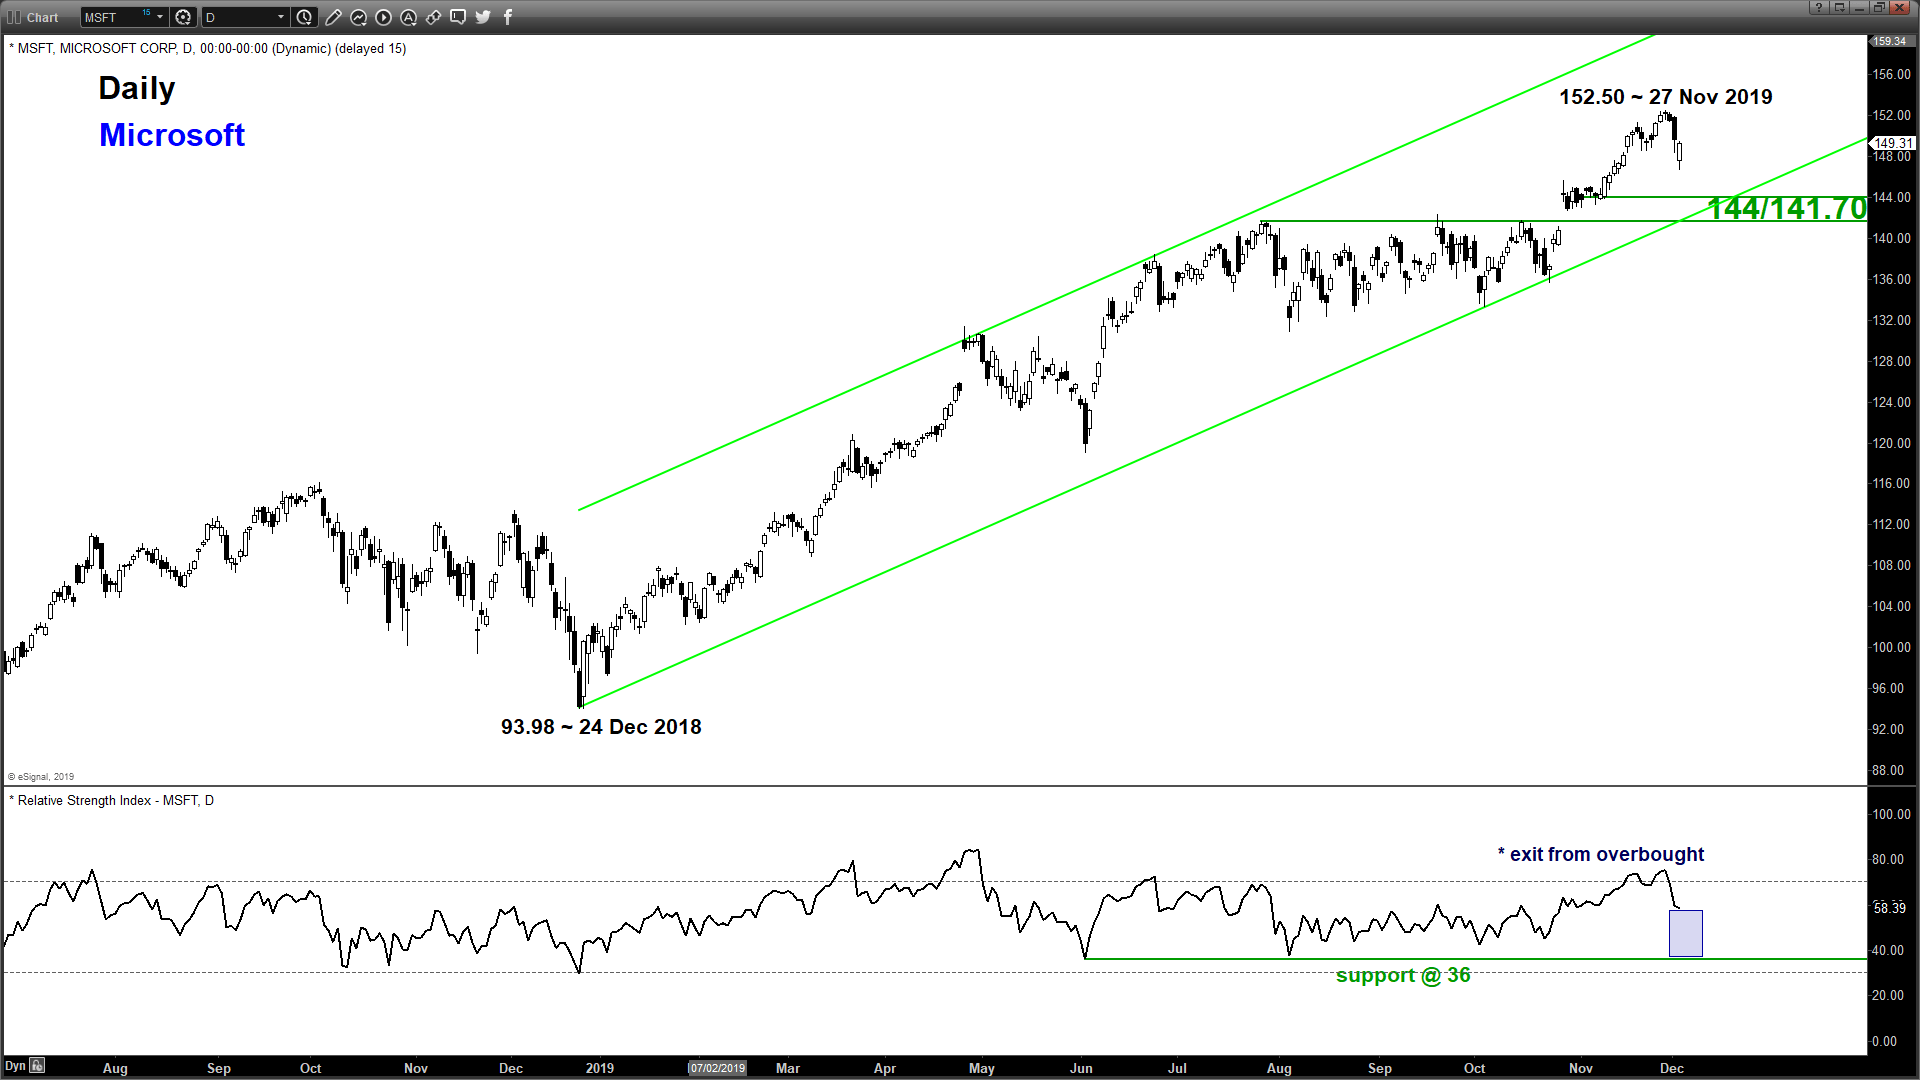
- The two biggest component weightage stocks in Nasdaq 100; Apple and Microsoft with a combined weight of 23% has started to show signs of potential mean reversion decline towards 232 support for Apple and 144/141.70 for Microsoft within their respective major uptrend phase that are still intact (refer to 3rd & 4th charts).
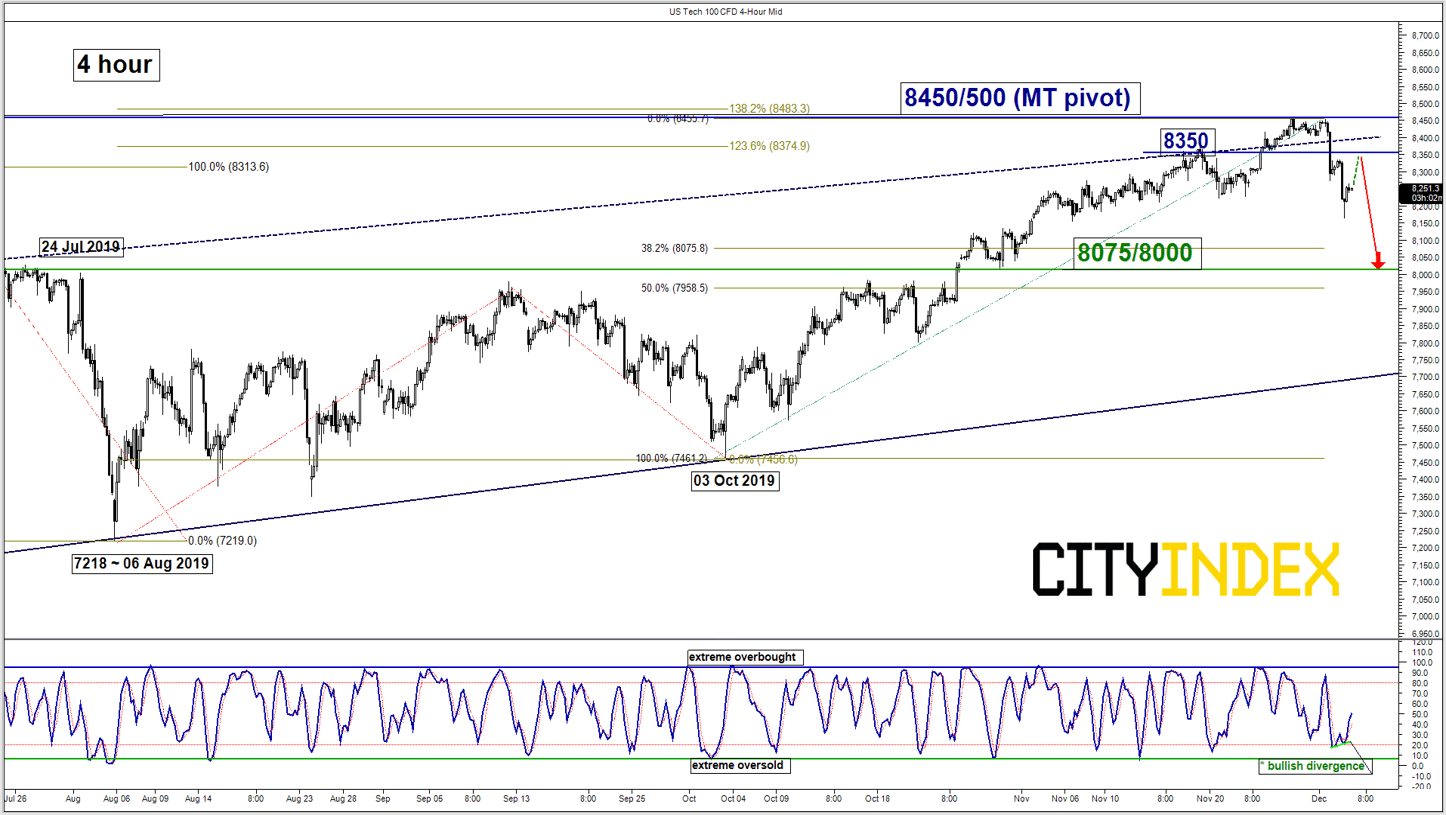
- In the short-term (1-3 days), the on-going down move sequence of the US Tech 100 from 27 Nov 2019 high of 8454 may now start to see a minor rebound as the 4-hour Stochastic oscillator has traced out a bullish divergence signal at its oversold region which indicates an overextended decline in the short-term.
- Potential minor rebound stands at 8350 which is defined by 61% Fibonacci retracement of the on-going slide from 27 Nov high to 03 Dec 2019 low of 8165 and the former minor swing high area of 19 Nov 2019.
- The next significant medium-term support rest at 8075/8000 which is defined by the former medium-term range resistance from 24 Jul 2019 and the 38.2% Fibonacci retracement of the recent up move from 03 Oct low to 27 Nov 2019 high.
Charts are from City Index Advantage TraderPro & eSignal
StoneX Financial Ltd (trading as “City Index”) is an execution-only service provider. This material, whether or not it states any opinions, is for general information purposes only and it does not take into account your personal circumstances or objectives. This material has been prepared using the thoughts and opinions of the author and these may change. However, City Index does not plan to provide further updates to any material once published and it is not under any obligation to keep this material up to date. This material is short term in nature and may only relate to facts and circumstances existing at a specific time or day. Nothing in this material is (or should be considered to be) financial, investment, legal, tax or other advice and no reliance should be placed on it.
No opinion given in this material constitutes a recommendation by City Index or the author that any particular investment, security, transaction or investment strategy is suitable for any specific person. The material has not been prepared in accordance with legal requirements designed to promote the independence of investment research. Although City Index is not specifically prevented from dealing before providing this material, City Index does not seek to take advantage of the material prior to its dissemination. This material is not intended for distribution to, or use by, any person in any country or jurisdiction where such distribution or use would be contrary to local law or regulation.
For further details see our full non-independent research disclaimer and quarterly summary.
CFDs are complex instruments and come with a high risk of losing money rapidly due to leverage. 69% of retail investor accounts lose money when trading CFDs with this provider. You should consider whether you understand how CFDs work and whether you can afford to take the high risk of losing your money. CFD and Forex Trading are leveraged products and your capital is at risk. They may not be suitable for everyone. Please ensure you fully understand the risks involved by reading our full risk warning.
City Index is a trading name of StoneX Financial Ltd. Head and Registered Office: 1st Floor, Moor House, 120 London Wall, London, EC2Y 5ET. StoneX Financial Ltd is a company registered in England and Wales, number: 05616586. Authorised and regulated by the Financial Conduct Authority. FCA Register Number: 446717.
City Index is a trademark of StoneX Financial Ltd.
The information on this website is not targeted at the general public of any particular country. It is not intended for distribution to residents in any country where such distribution or use would contravene any local law or regulatory requirement.
© City Index 2024