More questions than answers SP500
After a frantic five days moving house and unpacking, its back to the business of figuring out what comes next for markets. At the top line, this starts with updating our view on what comes next for the S&P 500, the bellwether of risk sentiment and because of its strong correlation with other risk assets.
Easier said than done because under the current COVID-19 regime, questions are abundant but there are very few clear cut answers. Most questions revolve around how authorities will manage the ongoing containment of the virus while at the same time looking to reopen economies.
What do each of the re-opening stages look like and will the subsequent economic recovery by V-shaped, U-shaped, L-shaped or perhaps W-shaped as a result of the virus remerging as a consequence of authorities re-opening economies too quickly?
Will equities then proceed to make new highs or new lows? Few appear to be giving serious thought to the possibility that until a vaccine is developed and as worsening economic data is offset by the huge amount of central bank and government stimulus, there is a third option - elevated volatility within large ranges for months ahead.
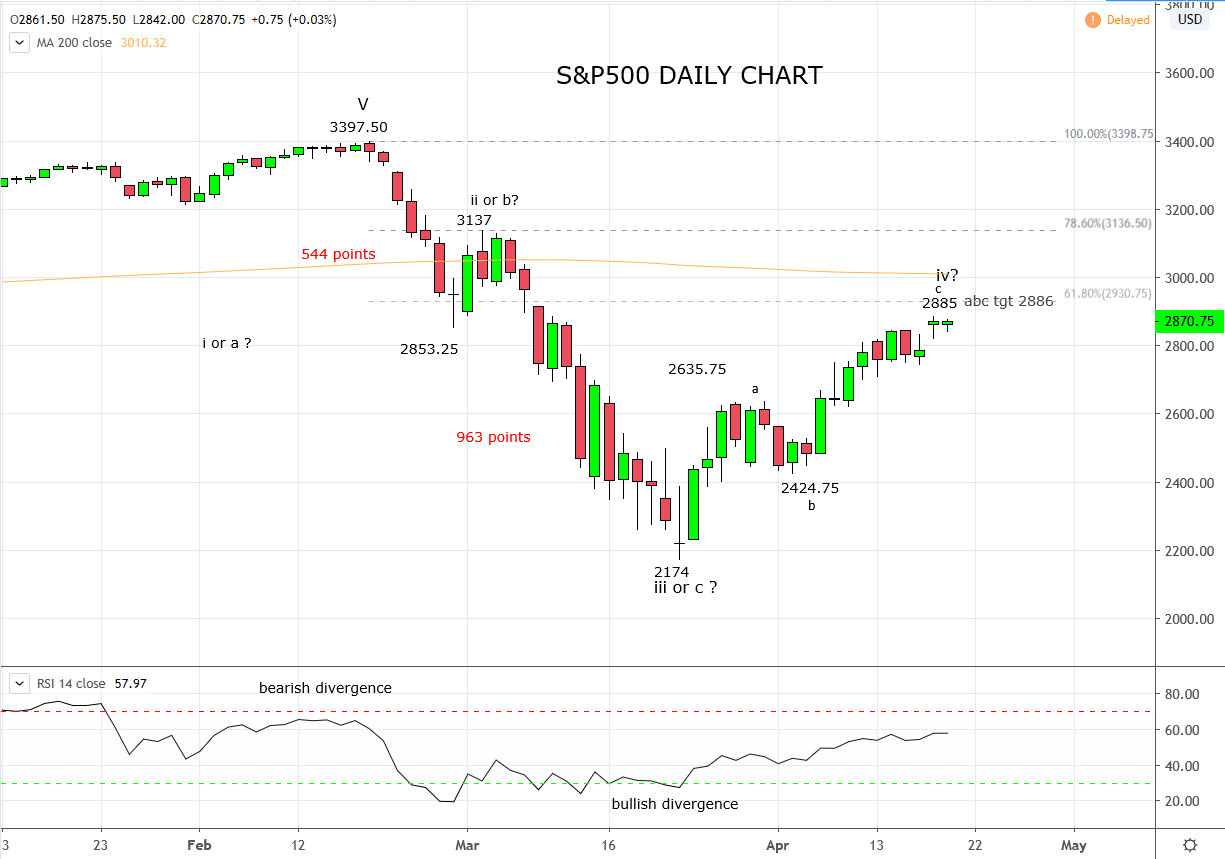
After its 30% recovery from its March low, the S&P500 has met and exceeded the recovery targets we set in early April “a break above recent highs and the 38.2% Fibonacci retracement, 2640/50 area would be confirmation that the next higher has commenced towards 2785/2850ish”
Given the “easy” part of the S&P500s recovery is now behind us we take this opportunity to move to a more neutral stance.
As a guide, I will be watching the price action develop in the 2886/2930 resistance zone (the “abc” wave equality target and the 61.8% Fibonacci retracement) for signs of a possible retracement lower. In this context, a break of the 2700/2690 support zone would be initial confirmation that a deeper retracement is underway and that it's deepening on a break of medium-term support at 2640/20.
However, until either of the key support levels mentioned above are broken, we are content to stand aside and allow the recovery to continue.
Source Tradingview. The figures stated areas of the 20th of April 2020. Past performance is not a reliable indicator of future performance. This report does not contain and is not to be taken as containing any financial product advice or financial product recommendation
StoneX Financial Ltd (trading as “City Index”) is an execution-only service provider. This material, whether or not it states any opinions, is for general information purposes only and it does not take into account your personal circumstances or objectives. This material has been prepared using the thoughts and opinions of the author and these may change. However, City Index does not plan to provide further updates to any material once published and it is not under any obligation to keep this material up to date. This material is short term in nature and may only relate to facts and circumstances existing at a specific time or day. Nothing in this material is (or should be considered to be) financial, investment, legal, tax or other advice and no reliance should be placed on it.
No opinion given in this material constitutes a recommendation by City Index or the author that any particular investment, security, transaction or investment strategy is suitable for any specific person. The material has not been prepared in accordance with legal requirements designed to promote the independence of investment research. Although City Index is not specifically prevented from dealing before providing this material, City Index does not seek to take advantage of the material prior to its dissemination. This material is not intended for distribution to, or use by, any person in any country or jurisdiction where such distribution or use would be contrary to local law or regulation.
For further details see our full non-independent research disclaimer and quarterly summary.
CFDs are complex instruments and come with a high risk of losing money rapidly due to leverage. 69% of retail investor accounts lose money when trading CFDs with this provider. You should consider whether you understand how CFDs work and whether you can afford to take the high risk of losing your money. CFD and Forex Trading are leveraged products and your capital is at risk. They may not be suitable for everyone. Please ensure you fully understand the risks involved by reading our full risk warning.
City Index is a trading name of StoneX Financial Ltd. Head and Registered Office: 1st Floor, Moor House, 120 London Wall, London, EC2Y 5ET. StoneX Financial Ltd is a company registered in England and Wales, number: 05616586. Authorised and regulated by the Financial Conduct Authority. FCA Register Number: 446717.
City Index is a trademark of StoneX Financial Ltd.
The information on this website is not targeted at the general public of any particular country. It is not intended for distribution to residents in any country where such distribution or use would contravene any local law or regulatory requirement.
© City Index 2024