Milk this NZD JPY below 80 as dairy prices fall again
The New Zealand dollar has received a double whammy of bad news in this first trading week of 2016. First, it was the disappointing manufacturing data out of China, New Zealand’s largest trading partner, on Monday that weighed heavily on commodity currencies and global stock markets. Today it was Fonterra’s turn to provide some bad news at its closely-watched bi-monthly auction. The world’s biggest dairy exporter’s GlobalDairyTrade (GDT) index fell 1.6%, giving back most of the 1.9% gain from the previous auction. More importantly for New Zealand, whole milk powder prices fell some 4.4%, though volumes increased. But overall this was a bad result for NZD as more than 7% of the nation’s GDP is generated from the dairy sector. The RBNZ had previously hinted that interest rates will not be cut further lower from the current level of 2.5%. But given the persistently weak commodity prices and renewed growth concerns about China, the central bank may have to loosen its policy further in order to support domestic demand. This could weigh heavily on the kiwi once again.
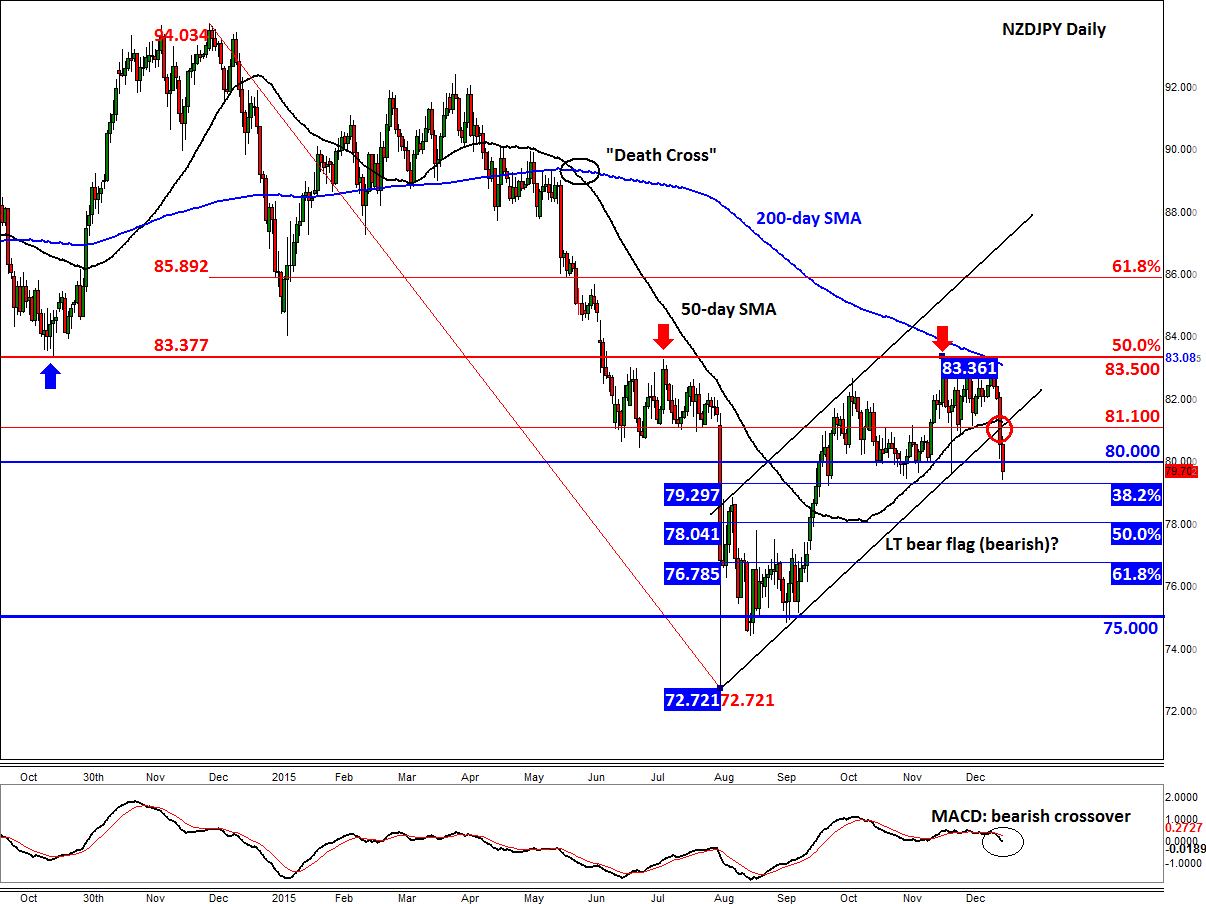
The NZD/USD may have already formed a peak after it was unable to break decisively above a bearish trend line that has been in place since July 2014, around 0.6850. Another NZD cross that is also beginning to look extremely bearish is the NZD/JPY. As can be seen from the daily chart, below, the cross has been making a series of lower highs since forming a peak at 94.00 back in December 2014. Then, during the peak of the last stock market turmoil, on 24 August 2015, the pair dropped viciously to form a low at 72.70. It had since been rising inside what appears to be a long-term bear flag pattern – until the rally ran out of steam around 83.35/50 in December. This area was previously support and resistance. At the start of this year, the NZD/JPY has broken below several key short-term support levels, including 81.00/25, which is where the 50-day average met the previous support and the lower trend of the bear flag pattern. Now that it has broken out of the bear flag to the downside, we could see a significant drop in the coming days.
At the time of this writing, the NZD/JPY was below another key support at 80.00 and was just shy of the 38.2% Fibonacci retracement level of the upswing from the August low, at 79.30. Should this level break down then there is nothing significant in terms of support until the 61.8% Fibonacci retracement at just below 76.80. The 50% retracement may offer some support, too, at 78.05. Below these levels the next important support is the psychologically-important 75.00 handle followed by the August 2015 low around 72.70. Meanwhile on the upside, the broken supports such as 80.00 and 81.00/25 could now turn into resistance upon re-test.
StoneX Financial Ltd (trading as “City Index”) is an execution-only service provider. This material, whether or not it states any opinions, is for general information purposes only and it does not take into account your personal circumstances or objectives. This material has been prepared using the thoughts and opinions of the author and these may change. However, City Index does not plan to provide further updates to any material once published and it is not under any obligation to keep this material up to date. This material is short term in nature and may only relate to facts and circumstances existing at a specific time or day. Nothing in this material is (or should be considered to be) financial, investment, legal, tax or other advice and no reliance should be placed on it.
No opinion given in this material constitutes a recommendation by City Index or the author that any particular investment, security, transaction or investment strategy is suitable for any specific person. The material has not been prepared in accordance with legal requirements designed to promote the independence of investment research. Although City Index is not specifically prevented from dealing before providing this material, City Index does not seek to take advantage of the material prior to its dissemination. This material is not intended for distribution to, or use by, any person in any country or jurisdiction where such distribution or use would be contrary to local law or regulation.
For further details see our full non-independent research disclaimer and quarterly summary.
CFDs are complex instruments and come with a high risk of losing money rapidly due to leverage. 69% of retail investor accounts lose money when trading CFDs with this provider. You should consider whether you understand how CFDs work and whether you can afford to take the high risk of losing your money. CFD and Forex Trading are leveraged products and your capital is at risk. They may not be suitable for everyone. Please ensure you fully understand the risks involved by reading our full risk warning.
City Index is a trading name of StoneX Financial Ltd. Head and Registered Office: 1st Floor, Moor House, 120 London Wall, London, EC2Y 5ET. StoneX Financial Ltd is a company registered in England and Wales, number: 05616586. Authorised and regulated by the Financial Conduct Authority. FCA Register Number: 446717.
City Index is a trademark of StoneX Financial Ltd.
The information on this website is not targeted at the general public of any particular country. It is not intended for distribution to residents in any country where such distribution or use would contravene any local law or regulatory requirement.
© City Index 2024