Kelvin Wong US stocks to watch in 2015
As 2014 drew to a close the US stock market, as measured by the bellwether S&P 500 index, was set to record another year-to-date double digit percentage gain, and a new historical high above the 2000-level. This has marked the fifth year of the major bullish trend in place since the famous “666”-low seen on 6 March 2009.
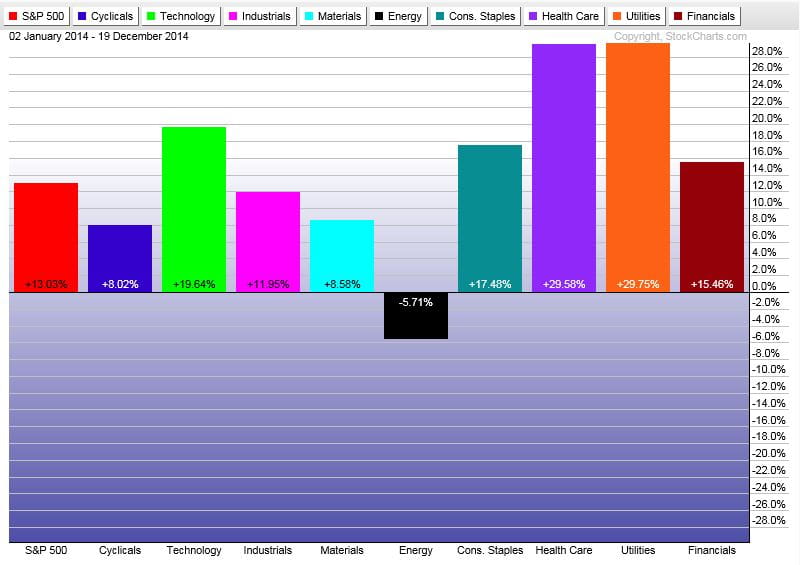
A breakdown of the nine major US sectors’ year-to-date returns (as of 19 December 2014) according to its respective SPDR Select Sector Exchange Traded Fund (ETF) is as follows:
Performance Statistics (excluding dividends) (2 January 2014 to 19 December 2014)
Source: www.stockcharts.com. Shown for illustrative purposes only. Past performance is no guarantee of future results.
The top three outperformers are Utilities (29.75%), Health Care (29.58%) and Technology (19.64%). In contrast, the energy sector is the worst performer , recording a negative return (-5.71%). The dismal performance seen in energy stocks is caused by a horrendous plunge of 49% in the price of crude oil that occurred in the second half of 2014.
Going forward, which sectors are likely to outperform the benchmark S&P 500 index in 2015? To answer this golden question, let’s use an objective approach to analysing their expected performance in 2015 by plotting the respective sector ETF against the S&P 500 ETF. This approach of technical analysis is called “Relative Strength” charting.
“Relative Strength” charting will enable us to have a gauge whether the respective sectors are outperforming, underperforming or neutral against the S&P 500.
The top three expected outperformers in 2015 are as follows, based on their respective “Relative Strength” charts:
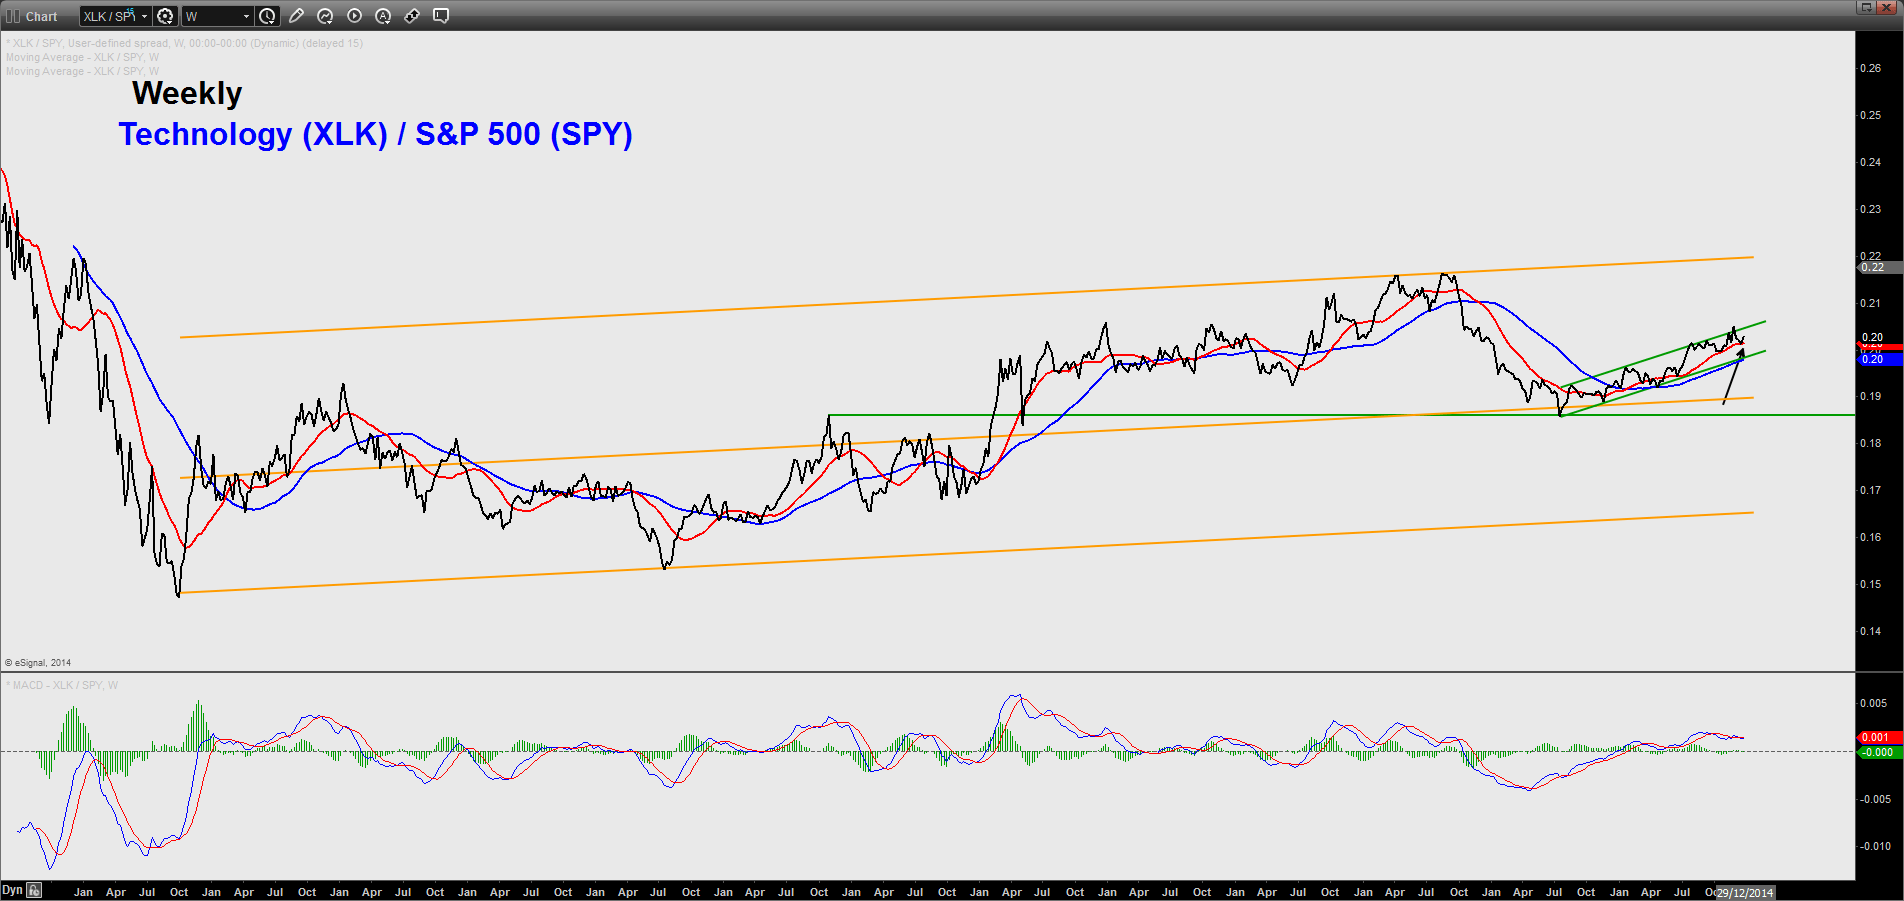
Technology
The Technology / S&P 500 ratio has continued to exhibit positive traits as it remains above its 20 and 50-week Moving Averages and still has ample “room” towards the upper boundary of its long-term ascending channel.
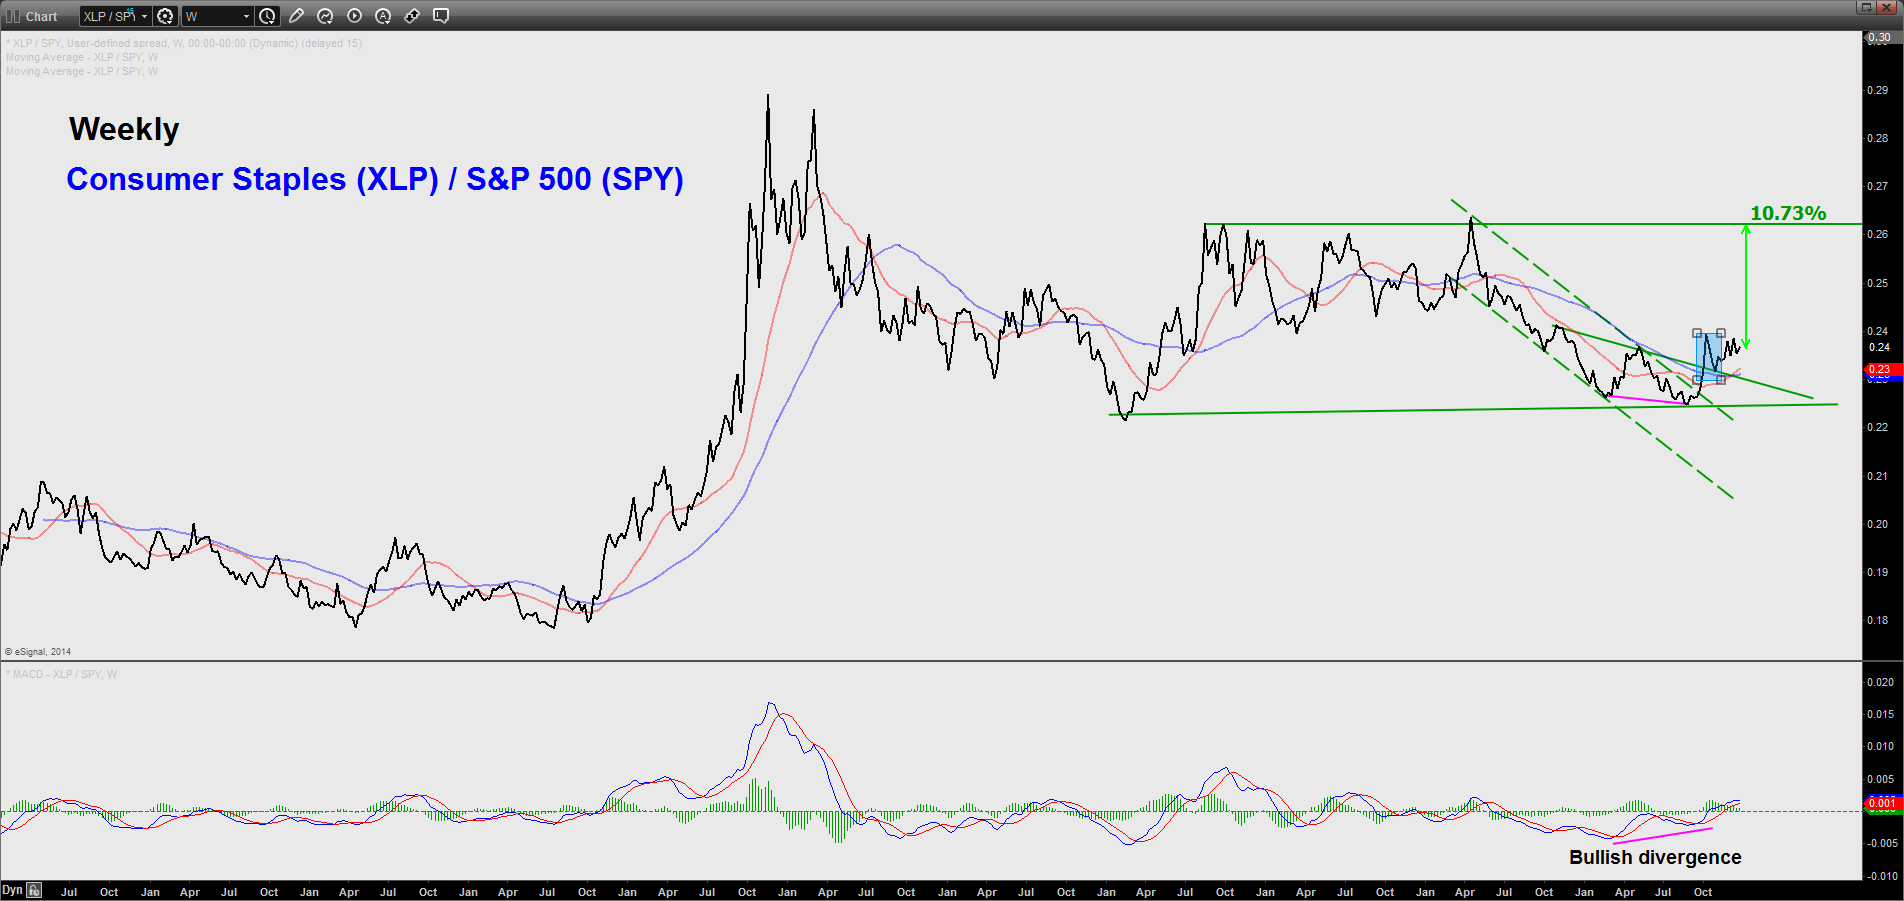
Consumer Staples
The Consumer Staples / S&P 500 ratio remains bullish since the breakout of its former trendline resistance and 20/50-week Moving Averages. Current elements advocate further upside potential towards its long-term range top.
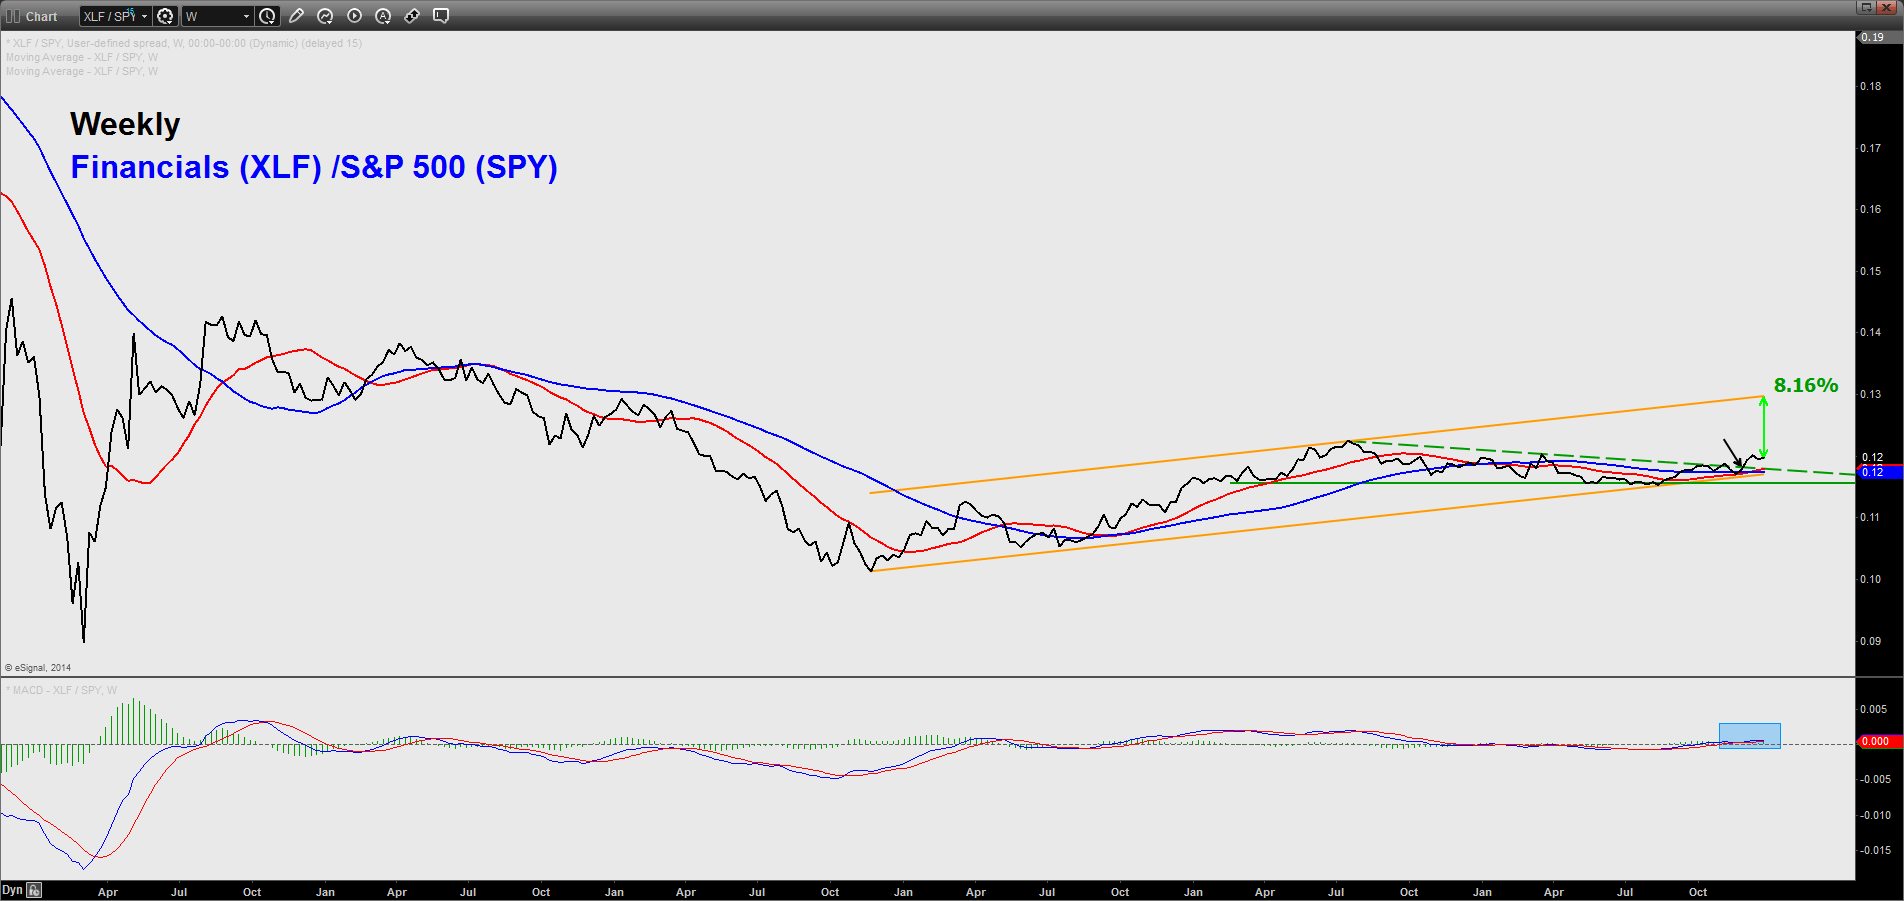
Financials
The Financials / S&P 500 ratio has broken above its former trendline resistance and has further upside potential towards the upper boundary of its long-term ascending channel. In addition, the MACD trend indicator has just turned bullish.
Within each of these three sectors (Technology, Consumer Staples & Financials), we have picked the following stocks to watch in 2015 from a technical analysis perspective.
Technology
- Apple Inc (AAPL)
- Facebook Inc (FB)
- Qualcomm Inc (QCOM)
Consumer Staples
- Keurig Green Mountain Inc (GMCR)
Financials
- Morgan Stanley (MS)
Let’s now take a look at these stocks’ key levels and expected targets.
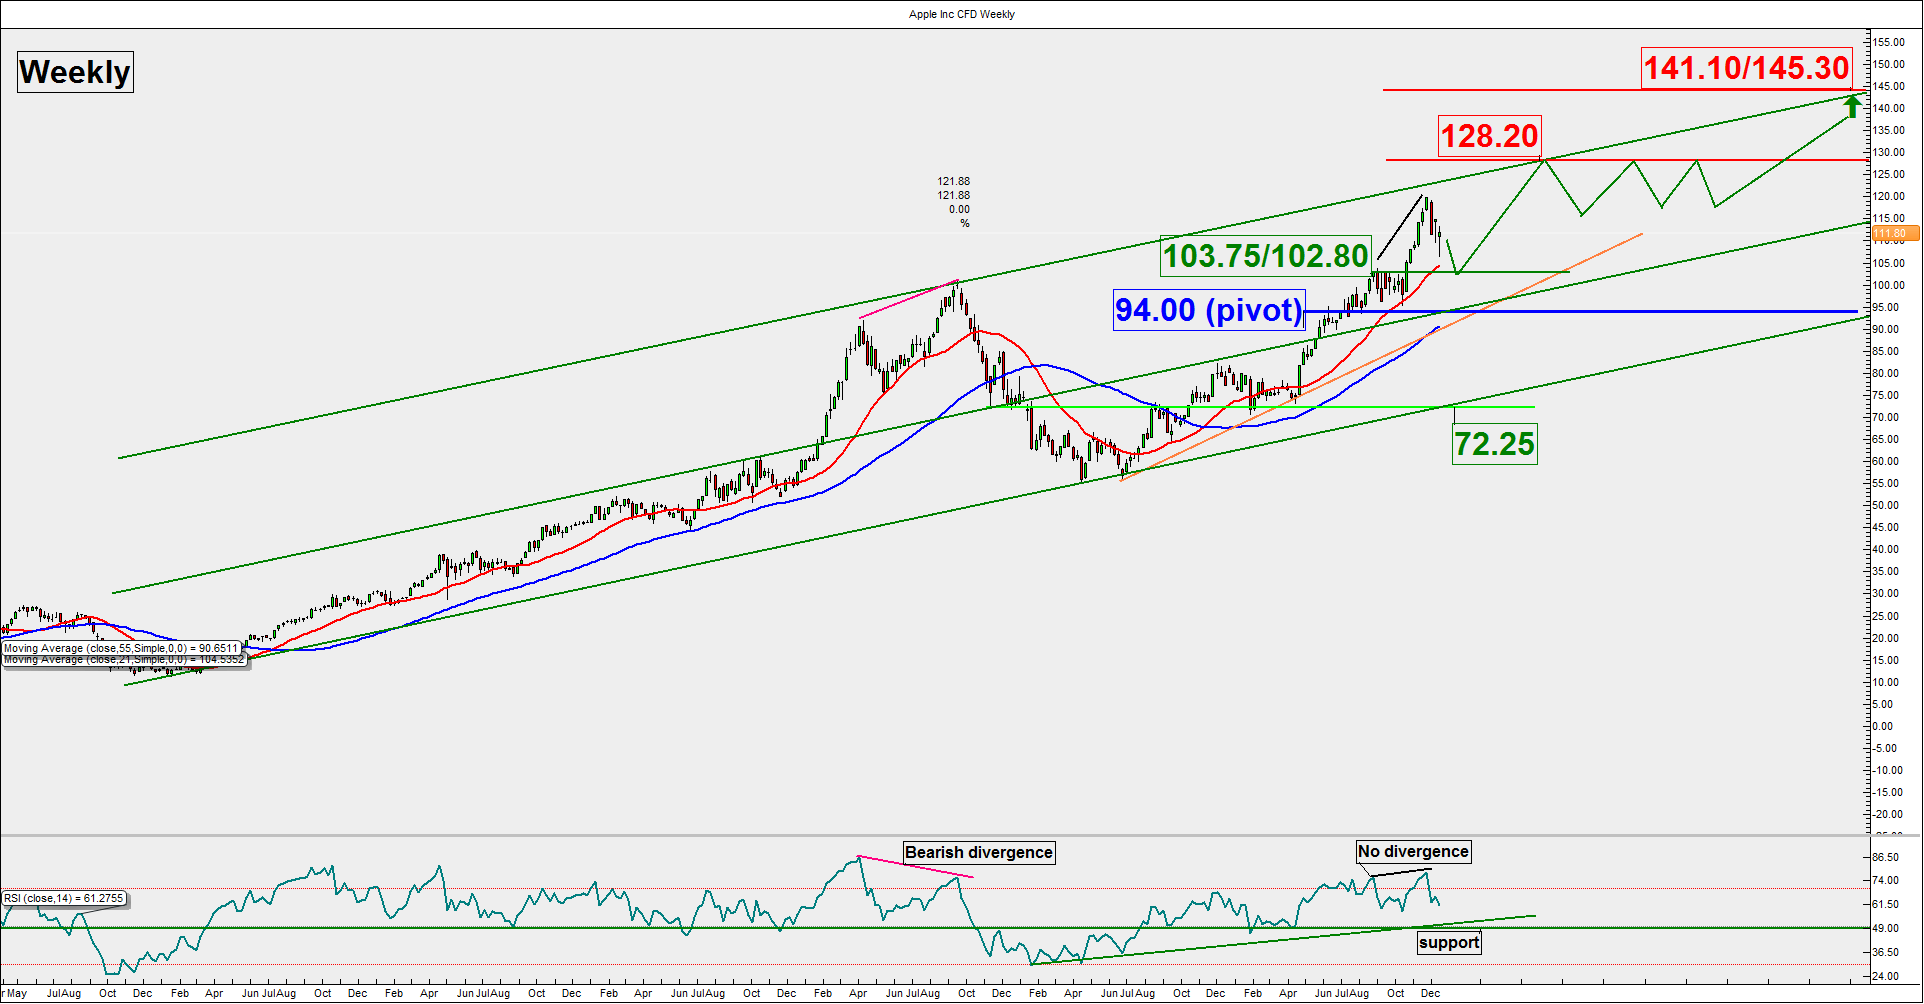
Apple Inc (AAPL)
Key elements
- Apple continues to evolve within the upper half of its long-term ascending channel in place since 2009.
- The upper of boundary of the ascending channel at 128.20 and 141.10/145.30 also confluences with a key Fibonacci projection level.
- The median line of the ascending channel is coming to support the stock at 94.00 which also coincides closely with the 50-week Moving Average.
- The RSI oscillator remains bullish above its supports.
Key levels (3 to 6 months)
- Intermediate support: 103.75/102.80
- Key support (pivot): 94.00
- Resistance (targets): 128.20 & 141.10/145.30
- Next support: 72.25
As long as the 94.00 pivotal support holds, Apple is likely to continue its long-term upside movement to target 128.20 before 141.10/145.30. However, a break below 94.00 may negate the bullish tone to see a correction towards 72.25 (lower boundary of the long-term ascending channel).
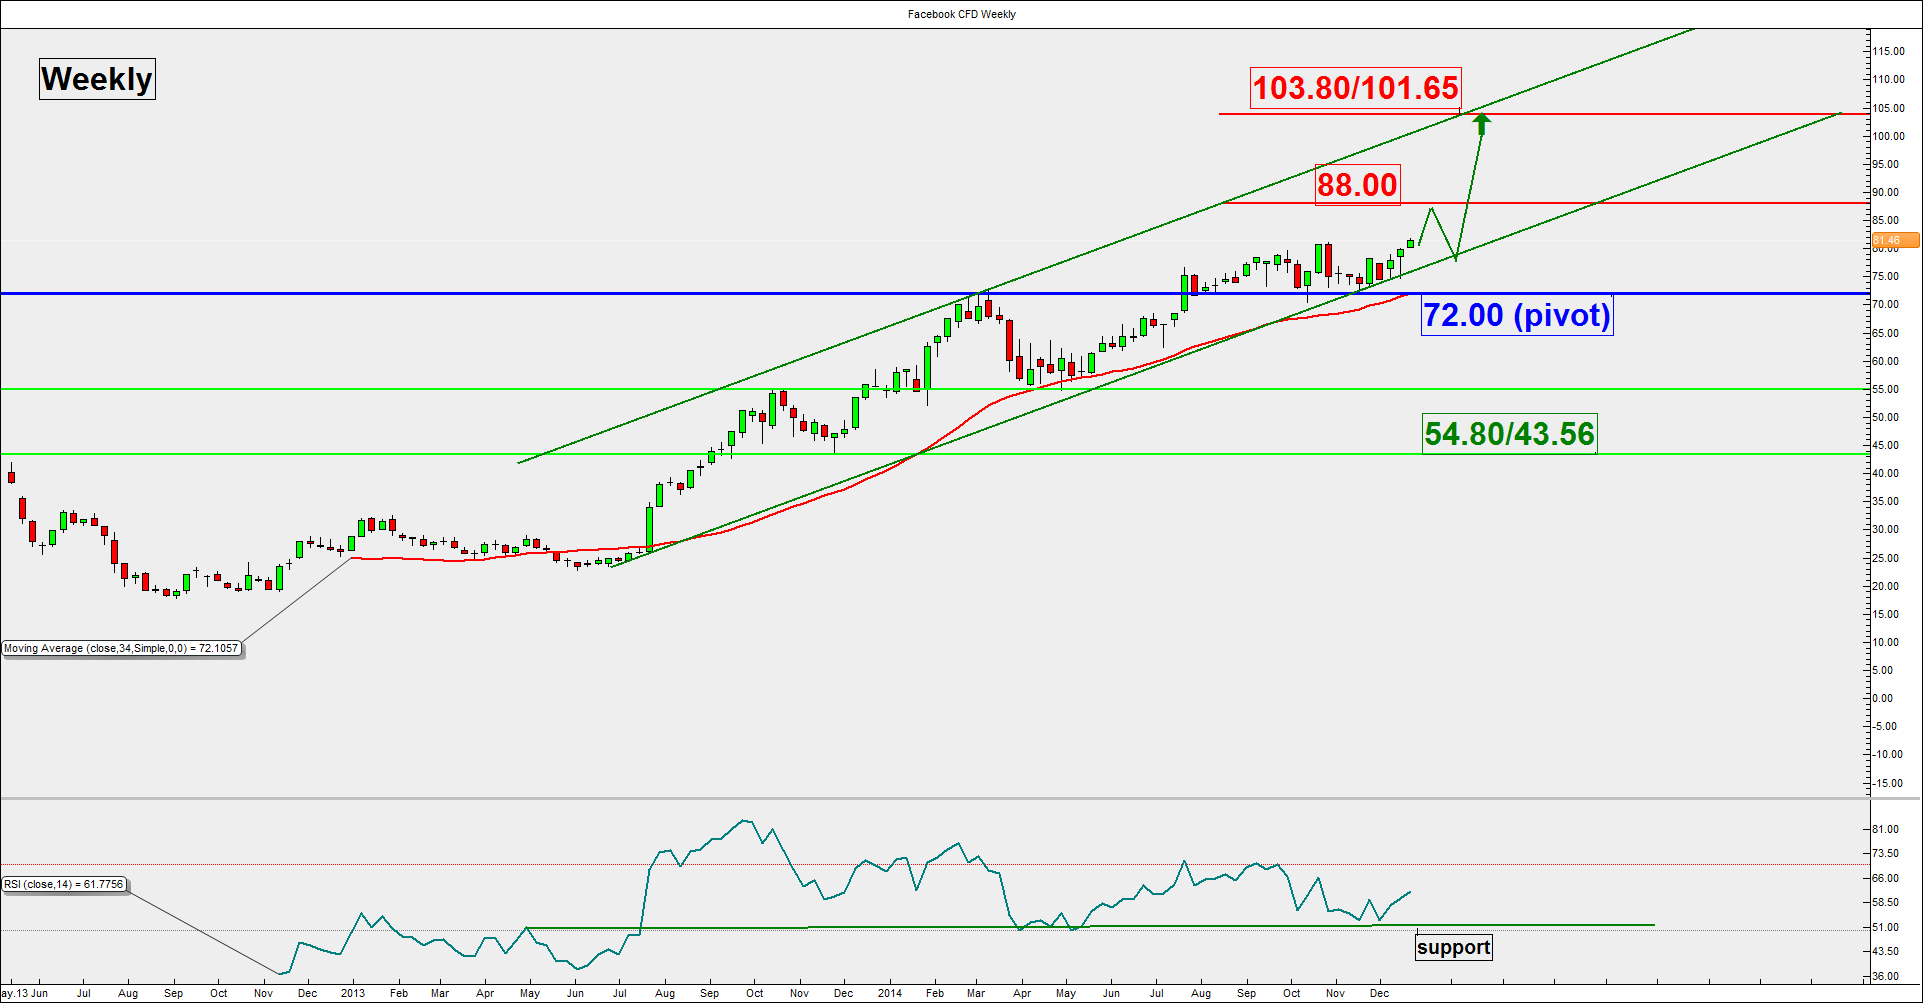
Facebook Inc (FB)
Key elements
- Facebook has managed to test and rebounded from the lower boundary of its long-term ascending channel in place since June 2013 at 72.00.
- The 72.00 level also coincides with the rising 34-day Moving Average.
- The upper boundary of the long-term ascending channel stands at 103.80/101.65 which also confluences with a key Fibonacci projection level.
- The RSI oscillator remains bullish above its support and 50% level.
Key levels (3 to 6 months)
- Key support (pivot): 72.00
- Resistance (targets): 88.00 & 103.80/101.65
- Next support: 54.80/43.56
The multi-year bullish trend remains intact for Facebook as long as the 72.00 pivotal support holds. Further potential upside movement is expected towards the 88.00 level before targeting 101.65/103.80. On the other hand, failure to hold above 72.00 may damage the bullish trend to see a correction towards the 54.80/43.56 zone.
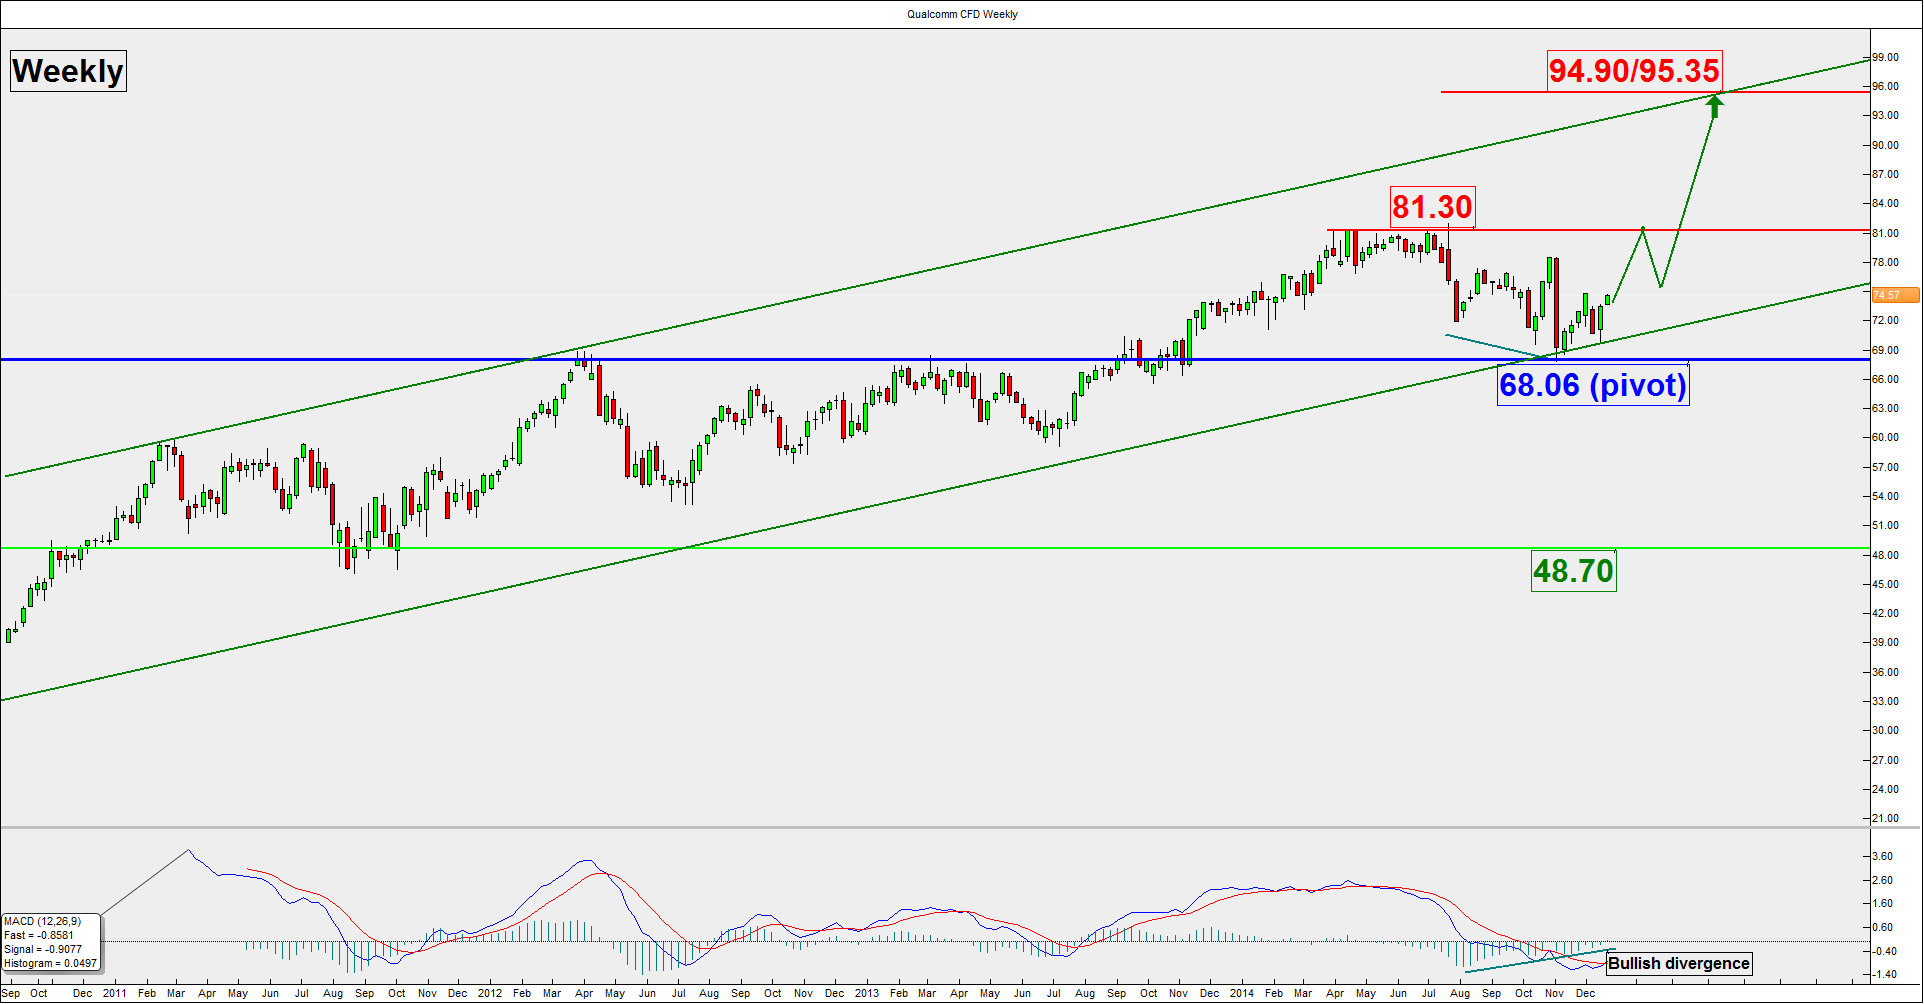
Qualcomm Inc (QCOM)
Key elements
- The recent multi-month decline from its high of 81.41 printed on 21 April 2014 has managed to find support at the lower boundary of its long-term ascending channel.
- The 68.06 significant horizontal support coincides with the lower boundary of its long-term ascending channel.
- The MACD Histogram has traced out a bullish divergence signal which suggests that a potential bullish reversal is round the corner for Qualcomm.
- The upper boundary of the long-term ascending channel stands at 94.90/95.35 which also confluences with a key Fibonacci projection level.
Key levels (3 to 6 months)
- Key support (pivot): 68.06
- Resistance (targets): 81.30 & 94.90/95.35
- Next support: 48.70
Qualcomm is likely to see another round of upside movement towards its recent swing high at 81.30 before targeting the long-term resistance zone at 94.90/95.35. However, failure to hold above the 68.06 pivotal support may damage the long-term bullish trend to see a correction towards 48.70.
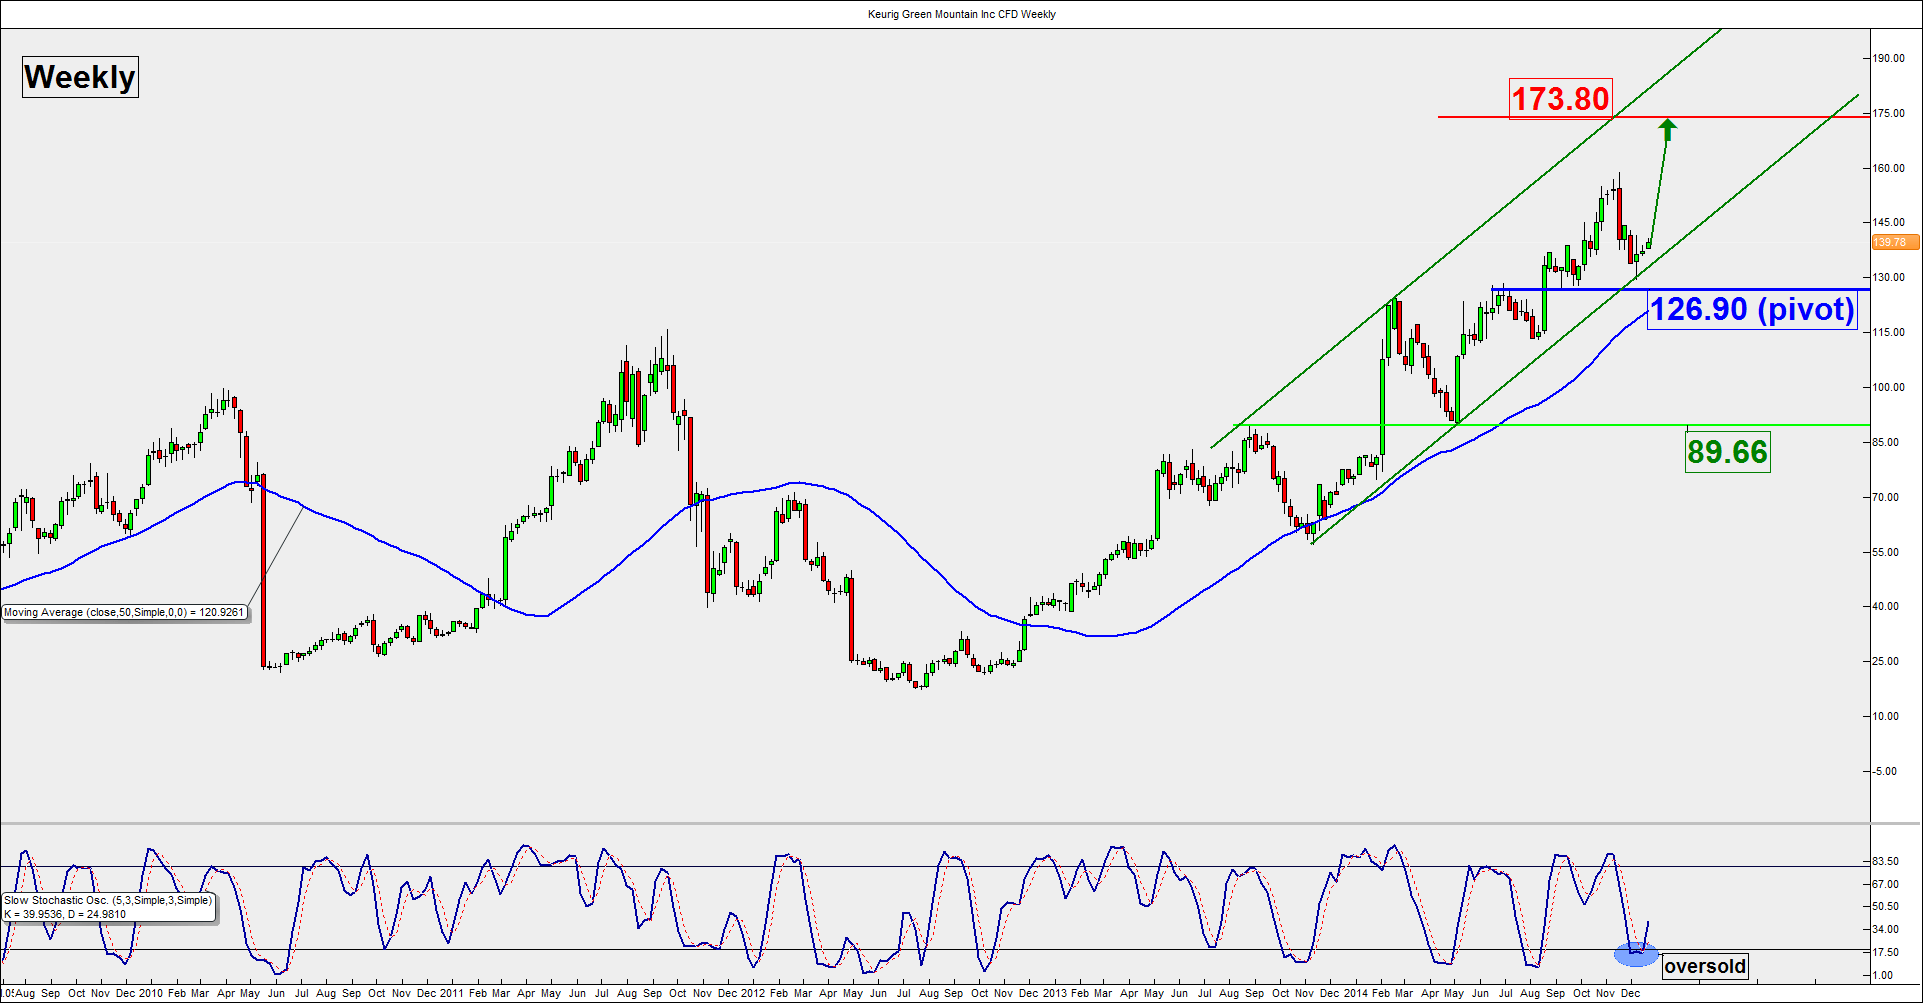
Keurig Green Mountain Inc (GMCR)
Key elements
- The multi-year bullish trend in place since July 2012 remains intact for Keurig Green Mountain and it has managed to stage a rebound above the lower boundary of its long-term ascending channel at 126.90.
- The 50-week Moving Average is coming to support the stock at 126.90.
- The upper boundary of its long-term ascending channel stands at 173.80 which also confluences with a key Fibonacci projection level.
- The Stochastic oscillator has just exited from its oversold region.
Key levels (3 to 6 months)
- Key support (pivot): 126.90
- Resistance (target): 173.80
- Next support: 89.66
As long as the 126.90 pivotal support holds, Keurig Green Mountain is likely to stage another round of potential upside movement to target 173.80. On the other hand, a break below 126.90 may invalidate the long-term bullish trend to trigger a correction towards 89.66.
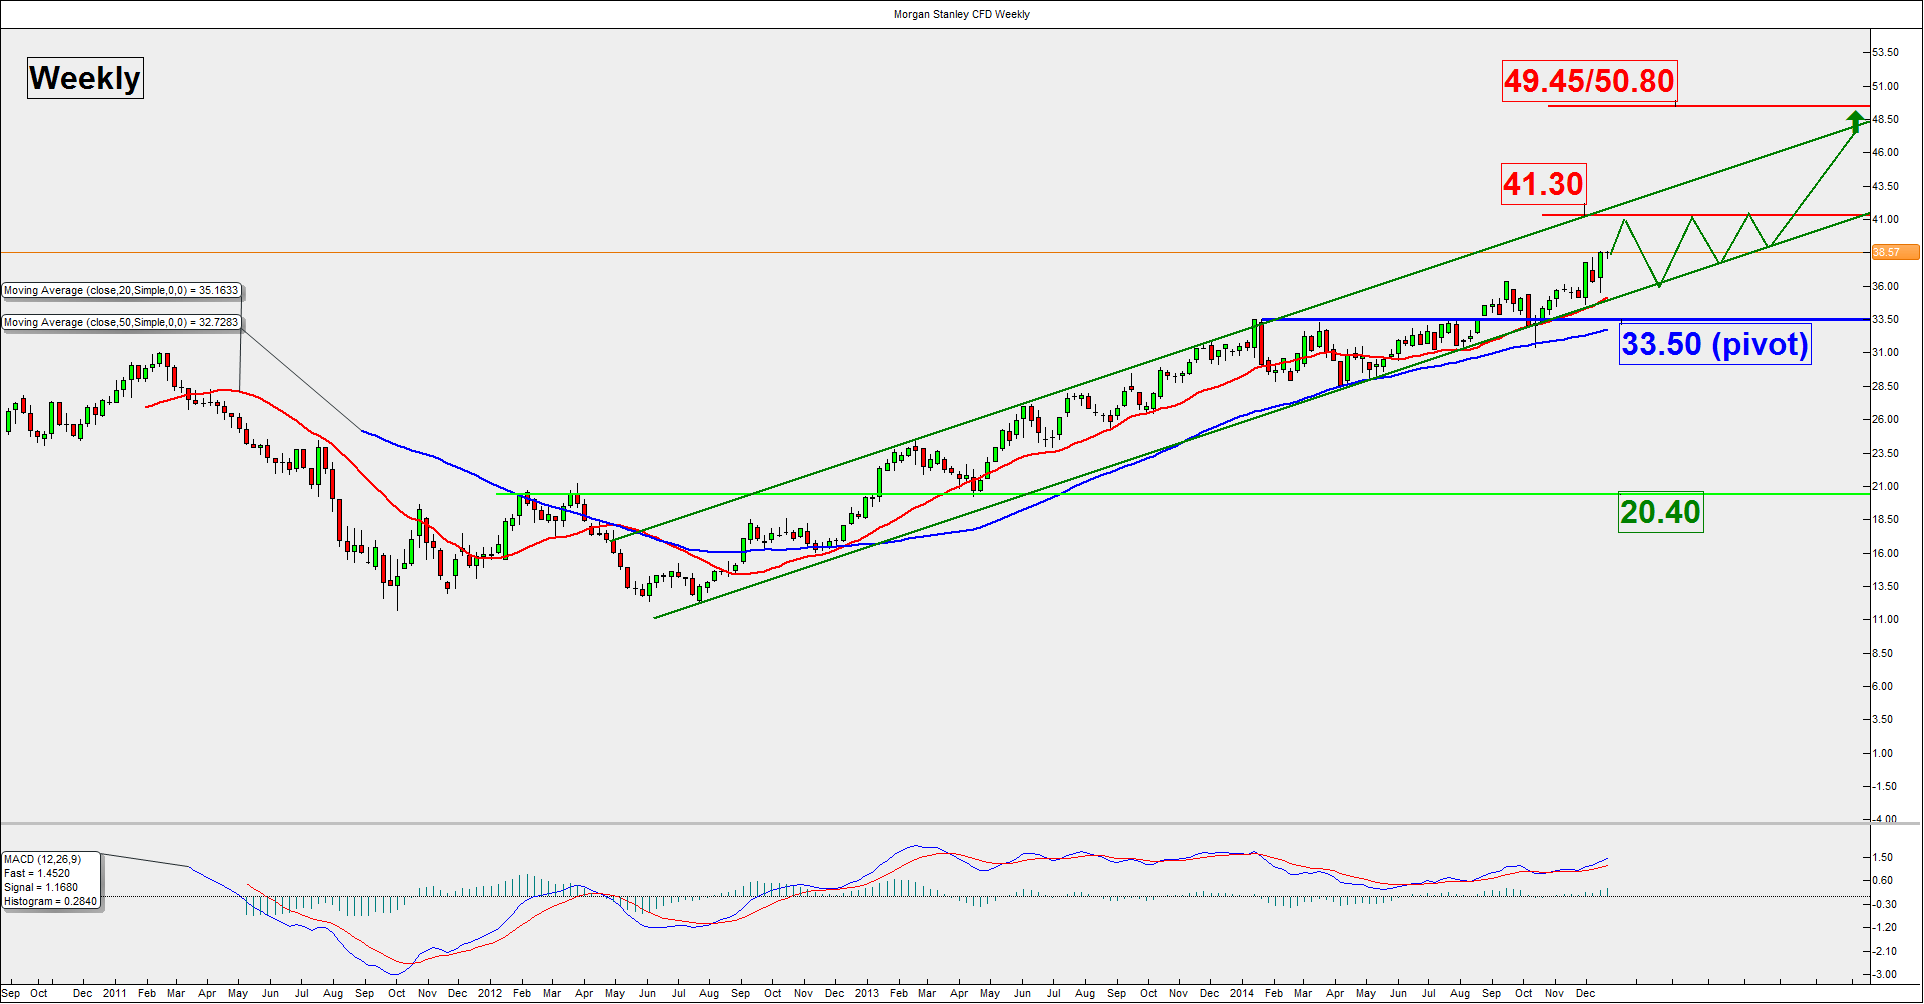
Morgan Stanley (MS)
Key elements
- Morgan Stanley continues to evolve within a multi-year ascending channel in place since July 2012.
- The upper boundary of the long-term ascending channel stands at 49.45/50.80 which also confluences with a key Fibonacci projection level.
- The 50-week Moving Average is coming to act as a support at 33.50.
- The MACD trend indicator remains bullish above its centreline.
Key levels (3 to 6 months)
- Key support (pivot): 33.50
- Resistance (targets): 41.30 & 49.45/50.80
- Next support: 20.40
As long as the 33.50 pivotal support holds, Morgan Stanley is likely to continue its multi-year upside movement to target 41.30 before 49.45/50.80. However, a break below 33.50 may damage the bullish trend to see a correction towards 20.40.
These are the stocks to watch in 2015 for those “alpha” seekers trading in the US stock market.
Charts are from City Index Advantage Trader & eSignal
If you found this article useful, you might also want to read Ashraf Laidi’s FX outlook for 2015, his other article on the dangers of underestimating deflation, and James Chen’s technical analysis of indices, currencies and commodities for 2015.
StoneX Financial Ltd (trading as “City Index”) is an execution-only service provider. This material, whether or not it states any opinions, is for general information purposes only and it does not take into account your personal circumstances or objectives. This material has been prepared using the thoughts and opinions of the author and these may change. However, City Index does not plan to provide further updates to any material once published and it is not under any obligation to keep this material up to date. This material is short term in nature and may only relate to facts and circumstances existing at a specific time or day. Nothing in this material is (or should be considered to be) financial, investment, legal, tax or other advice and no reliance should be placed on it.
No opinion given in this material constitutes a recommendation by City Index or the author that any particular investment, security, transaction or investment strategy is suitable for any specific person. The material has not been prepared in accordance with legal requirements designed to promote the independence of investment research. Although City Index is not specifically prevented from dealing before providing this material, City Index does not seek to take advantage of the material prior to its dissemination. This material is not intended for distribution to, or use by, any person in any country or jurisdiction where such distribution or use would be contrary to local law or regulation.
For further details see our full non-independent research disclaimer and quarterly summary.
CFDs are complex instruments and come with a high risk of losing money rapidly due to leverage. 69% of retail investor accounts lose money when trading CFDs with this provider. You should consider whether you understand how CFDs work and whether you can afford to take the high risk of losing your money. CFD and Forex Trading are leveraged products and your capital is at risk. They may not be suitable for everyone. Please ensure you fully understand the risks involved by reading our full risk warning.
City Index is a trading name of StoneX Financial Ltd. Head and Registered Office: 1st Floor, Moor House, 120 London Wall, London, EC2Y 5ET. StoneX Financial Ltd is a company registered in England and Wales, number: 05616586. Authorised and regulated by the Financial Conduct Authority. FCA Register Number: 446717.
City Index is a trademark of StoneX Financial Ltd.
The information on this website is not targeted at the general public of any particular country. It is not intended for distribution to residents in any country where such distribution or use would contravene any local law or regulatory requirement.
© City Index 2024