JP Morgan rejected at key range resistance ahead of earnings
JP Moragan Chase (JPM)
click to enlarge charts
Key elements
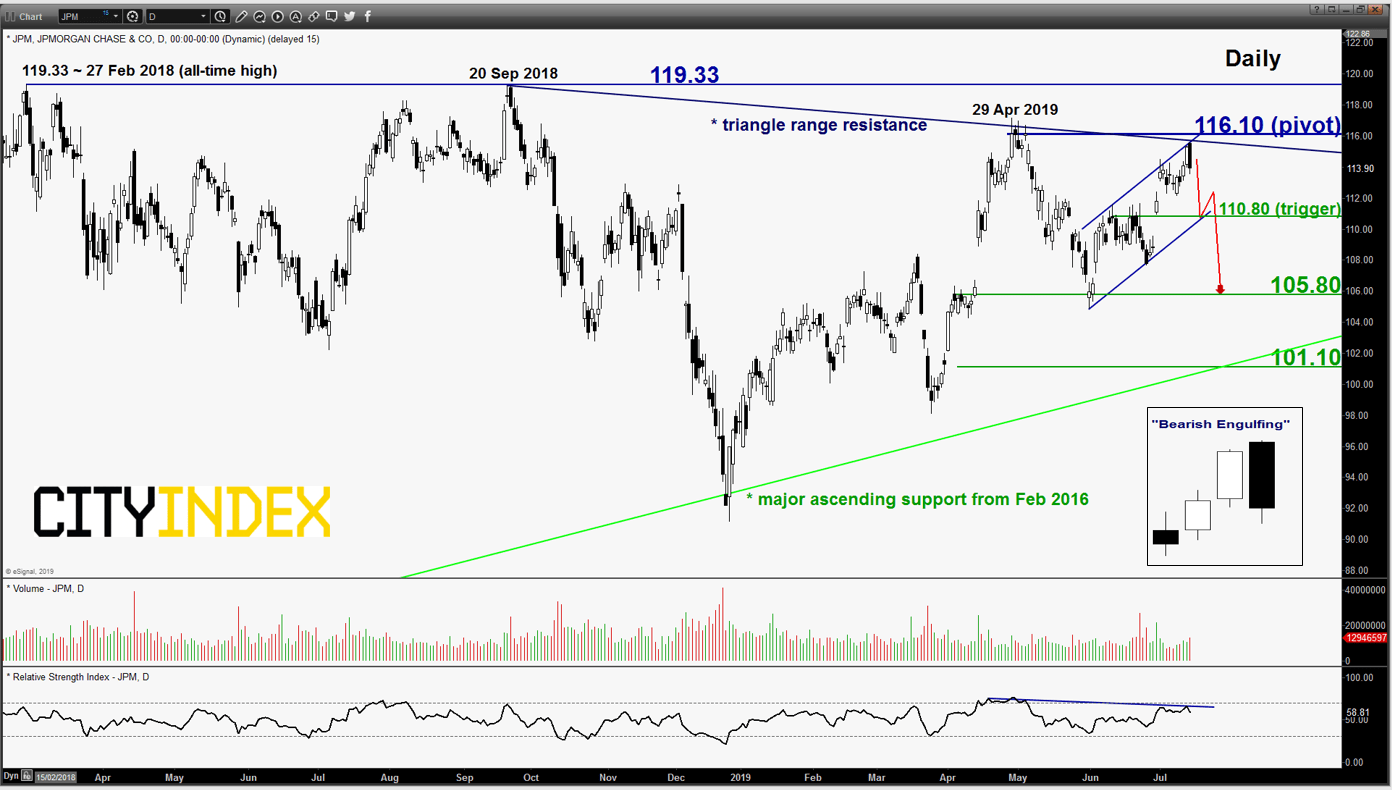
- The recent 10% up move of JPM share price from its 31 May 2019 low has tested the medium-term “triangle range” resistance in place since 20 Sep 2018 where it has tested and failed to break above its current all-time high level of 119.33 printed on 27 Feb 2018.
- JPM has declined by -1.77%; that underperformed the Financials sector (-0.57%) which was the 2nd worst performer among the S&P sectors in yesterday, 15 Jul U.S. session.
- The price action of JPM has formed a daily “Bearish Engulfing” pattern at end of yesterday’s U.S. session right at the aforementioned “triangle range” resistance.
- Near-term support rests at 110.80 which is defined by a minor “ascending range” support in place since 31 May 2019 low.
- Key medium-term resistance stands at 116.10 as per defined a Fibonacci projection cluster and close to the medium-term “triangle range” resistance.
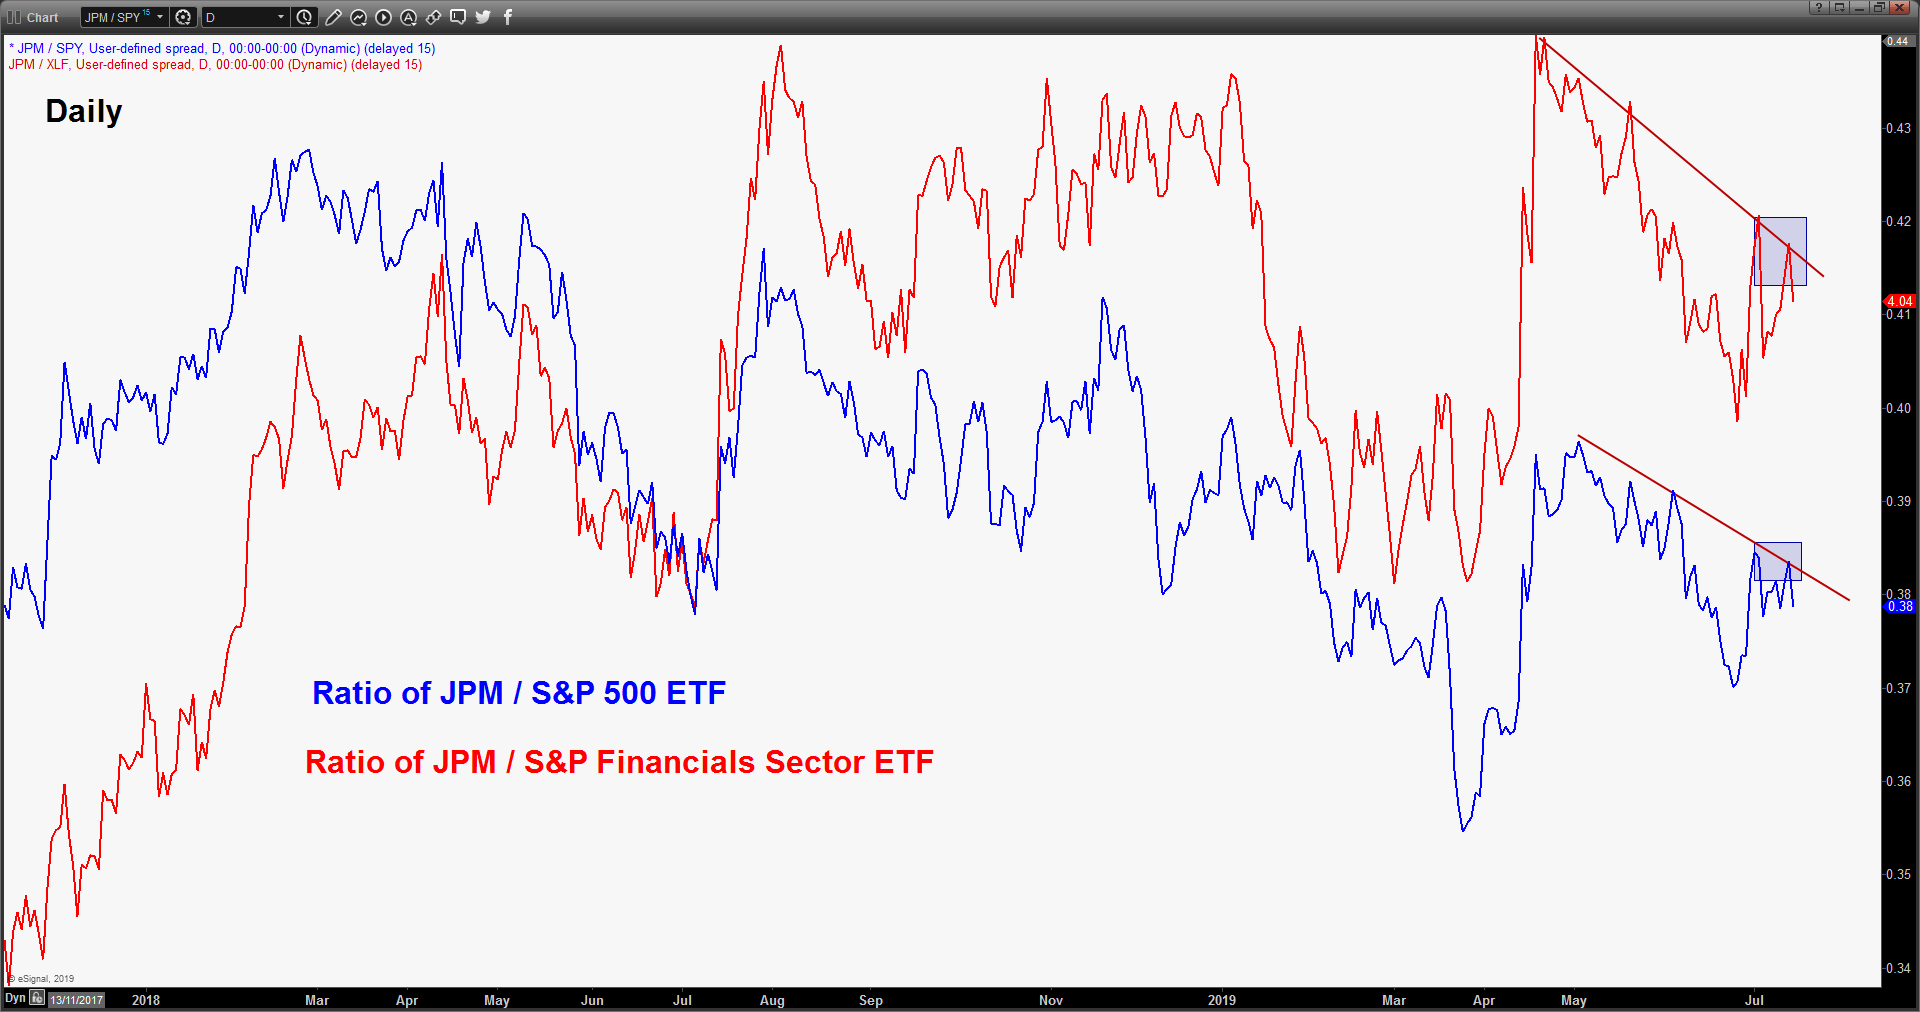
- Relative strength analysis from the ratios of JPM against its industry sector (S&P Financials XLF) and the U.S. benchmark stock index (S&P 500) have continued to exhibit medium-term weakness/underperformance.
Key Levels (1 to 3 weeks)
Pivot (key resistance): 116.10
Supports: 110.80 & 105.80
Next resistance: 119.33
Conclusion
If the 116.10 pivotal resistance is not surpassed and a break with a daily close below 110.80 is likely to see a further potential push down to target the next support at 105.80.
On the other hand, a clearance with a daily close above 116.10 sees a squeeze up to retest the all-time high of 119.33.
Charts are from eSignal
StoneX Financial Ltd (trading as “City Index”) is an execution-only service provider. This material, whether or not it states any opinions, is for general information purposes only and it does not take into account your personal circumstances or objectives. This material has been prepared using the thoughts and opinions of the author and these may change. However, City Index does not plan to provide further updates to any material once published and it is not under any obligation to keep this material up to date. This material is short term in nature and may only relate to facts and circumstances existing at a specific time or day. Nothing in this material is (or should be considered to be) financial, investment, legal, tax or other advice and no reliance should be placed on it.
No opinion given in this material constitutes a recommendation by City Index or the author that any particular investment, security, transaction or investment strategy is suitable for any specific person. The material has not been prepared in accordance with legal requirements designed to promote the independence of investment research. Although City Index is not specifically prevented from dealing before providing this material, City Index does not seek to take advantage of the material prior to its dissemination. This material is not intended for distribution to, or use by, any person in any country or jurisdiction where such distribution or use would be contrary to local law or regulation.
For further details see our full non-independent research disclaimer and quarterly summary.
CFDs are complex instruments and come with a high risk of losing money rapidly due to leverage. 69% of retail investor accounts lose money when trading CFDs with this provider. You should consider whether you understand how CFDs work and whether you can afford to take the high risk of losing your money. CFD and Forex Trading are leveraged products and your capital is at risk. They may not be suitable for everyone. Please ensure you fully understand the risks involved by reading our full risk warning.
City Index is a trading name of StoneX Financial Ltd. Head and Registered Office: 1st Floor, Moor House, 120 London Wall, London, EC2Y 5ET. StoneX Financial Ltd is a company registered in England and Wales, number: 05616586. Authorised and regulated by the Financial Conduct Authority. FCA Register Number: 446717.
City Index is a trademark of StoneX Financial Ltd.
The information on this website is not targeted at the general public of any particular country. It is not intended for distribution to residents in any country where such distribution or use would contravene any local law or regulatory requirement.
© City Index 2024