Japan falls into recession USD JPY bulls may target 13 year high around 125 00
It’s been a quiet start to the week as the world reflects on the horrific terrorist attack in Paris over the weekend. Our thoughts remain with all the families impacted by this weekend’s awful events, but the impact on markets has thus far been limited.
USD/JPY initially gapped lower as traders bought the safe have yen, but a weaker-than-expected Japanese GDP report quickly drove the pair back higher. Japan’s Q3 Preliminary GDP reading game out at -0.2% q/q, worse than that -0.1% reading anticipated by economists. Alarmingly, the capital expenditure portion of the report fell by 1.3%, showing that Japanese businesses remain wary of the future outlook for the economy, though private consumption did rise a relatively healthy 0.5% q/q.
Combined with the negative Q2 GDP reading, this means that the country has fallen into an technical “recession” (two consecutive quarters of falling GDP). For its part, the Bank of Japan had already anticipated disappointing economic growth in its forecasts, so today’s weak reading alone is unlikely to prompt more easing from the central bank. That said, if the economy doesn’t recover meaningfully heading into Q1 2016, the BOJ may have no choice but to expand stimulus.
Technical view: USD/JPY
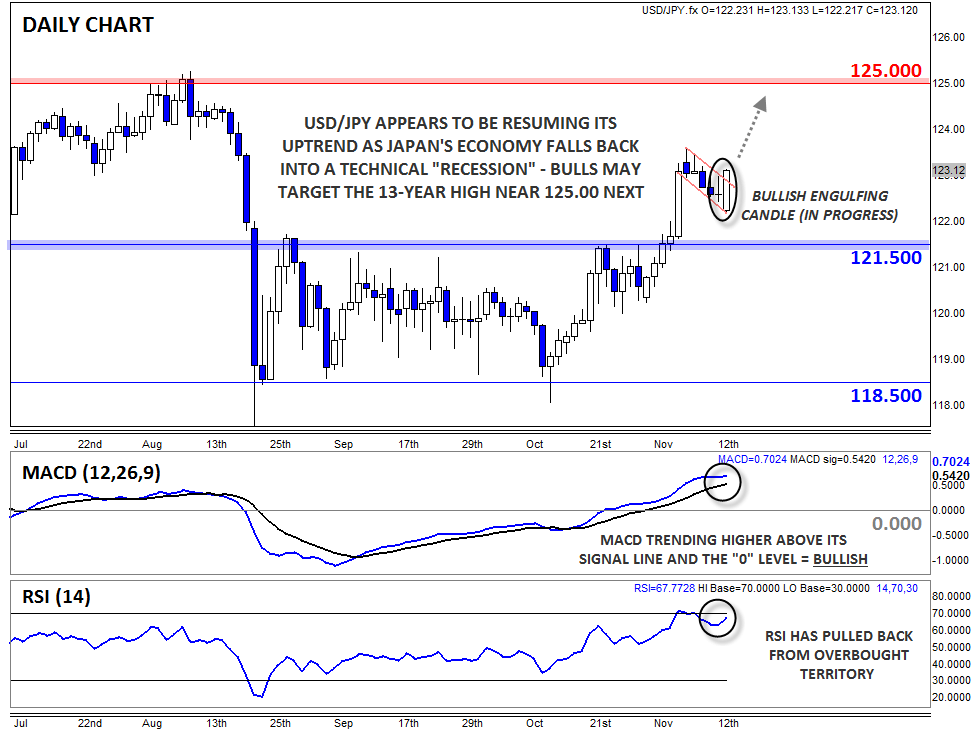
USD/JPY has rallied sharply off the bearish gap lows to regain the 123.00 level as of writing, and more importantly, rates appear to be breaking out of last week’s bullish flag pattern. If you’re not familiar, a bullish flag pattern is created by a shallow, controlled pullback after the big rally and suggests that the uptrend is likely to resume once we clear the top of the near-term bearish channel.
Meanwhile, the secondary indicators are also pointing to the potential for further gains in USD/JPY. To wit, the MACD continues to trend higher above its signal line and the “0” level, showing bullish momentum, while the RSI indicator has pulled back from overbought territory. With today’s price action forming a possible Bullish Engulfing candle*, the stage could be set for more USD/JPY strength this week.
To the topside, the next hurdle to watch will be last week’s high at 123.60, which also represents the 78.6% Fibonacci retracement (not shown). Above that barrier, bulls could try to push USD/JPY back toward its 13-year high around 125.00. At this point, only a break below today’s low at 122.20 would erase the near-term bullish bias.
*A Bullish Engulfing candle is formed when the candle breaks below the low of the previous time period before buyers step in and push rates up to close above the high of the previous time period. It indicates that the buyers have wrested control of the market from the sellers.
StoneX Financial Ltd (trading as “City Index”) is an execution-only service provider. This material, whether or not it states any opinions, is for general information purposes only and it does not take into account your personal circumstances or objectives. This material has been prepared using the thoughts and opinions of the author and these may change. However, City Index does not plan to provide further updates to any material once published and it is not under any obligation to keep this material up to date. This material is short term in nature and may only relate to facts and circumstances existing at a specific time or day. Nothing in this material is (or should be considered to be) financial, investment, legal, tax or other advice and no reliance should be placed on it.
No opinion given in this material constitutes a recommendation by City Index or the author that any particular investment, security, transaction or investment strategy is suitable for any specific person. The material has not been prepared in accordance with legal requirements designed to promote the independence of investment research. Although City Index is not specifically prevented from dealing before providing this material, City Index does not seek to take advantage of the material prior to its dissemination. This material is not intended for distribution to, or use by, any person in any country or jurisdiction where such distribution or use would be contrary to local law or regulation.
For further details see our full non-independent research disclaimer and quarterly summary.
CFDs are complex instruments and come with a high risk of losing money rapidly due to leverage. 69% of retail investor accounts lose money when trading CFDs with this provider. You should consider whether you understand how CFDs work and whether you can afford to take the high risk of losing your money. CFD and Forex Trading are leveraged products and your capital is at risk. They may not be suitable for everyone. Please ensure you fully understand the risks involved by reading our full risk warning.
City Index is a trading name of StoneX Financial Ltd. Head and Registered Office: 1st Floor, Moor House, 120 London Wall, London, EC2Y 5ET. StoneX Financial Ltd is a company registered in England and Wales, number: 05616586. Authorised and regulated by the Financial Conduct Authority. FCA Register Number: 446717.
City Index is a trademark of StoneX Financial Ltd.
The information on this website is not targeted at the general public of any particular country. It is not intended for distribution to residents in any country where such distribution or use would contravene any local law or regulatory requirement.
© City Index 2024