HSBC 8217 s 8220 good year 8221 a tough sell to investors
HSBC has taken the surprising decision to book an impairment charge of $3.2bn related its European private banking unit in its 2016 financial year.
This, together with the removed contribution from businesses in Brazil, which the bank sold last year, and hedge losses on its own debt, resulted in a huge ‘miss’ of more than $7bn compared to investors’ expectations of pre-tax profit.
In recording what is largely a goodwill charge related to the acquisition of Safra Republic Holdings in 1999 (about which the group continues to offer only sparse further details) HSBC risks depleting another type of goodwill: that of shareholders. The widely overlooked issue from Safra and the depth of the ‘revenue cliff’ from Brazil have turned out to be far larger than foreseeable from formal guidance or indicative commentary over the last year, and that is why shareholders gave the stock a rough ride on Tuesday.
Was the group correct to judge that it was “appropriate to write off the remaining goodwill in the European private banking business”? On balance, it seems to us that it was, particularly in view of the group’s strategy for Europe going forward. Should HSBC have been more forthcoming about the quantum of the impact from the Brazil disposals and the European private banking impairment? It’s not easy to understand HSBC’s reticence.
The extension of the group’s share buyback by another $1bn—well within HSBC’s current cash resource—will go some way to cushioning the hit to sentiment this morning, however we think applause for the additional pay-out is somewhat muted in view of HSBC’s backsliding common equity tier one ratio. It stood at 13.6% at year-end against 13.9% in Q3. It’s a modest retreat of regulatory capital, so direct consequences will be immaterial, but again, the timing is unfortunate.
Tumbling returns, however, are more likely to lead to a more material and longer-lasting clip of the shares, which rose as much as 80% since 24th June last year. It’s difficult to look through the one-off hit to reported return on tangible equity (ROTE) dealt by the unexpected impairments and deeper than forecast contribution decline from Brazil. Reported ROTE crashes from 7.2% at the end of 2015 to 0.8% at year-end 2016, and is barely better on an underlying basis at 2.6%.
Notwithstanding the “difficult operating environment” in 2016 flagged by finance director Iain Mackay on Tuesday, it’s going to take a while for investors to come round to appreciating HSBC’s “good year for 2016, in terms of operating profitability”.
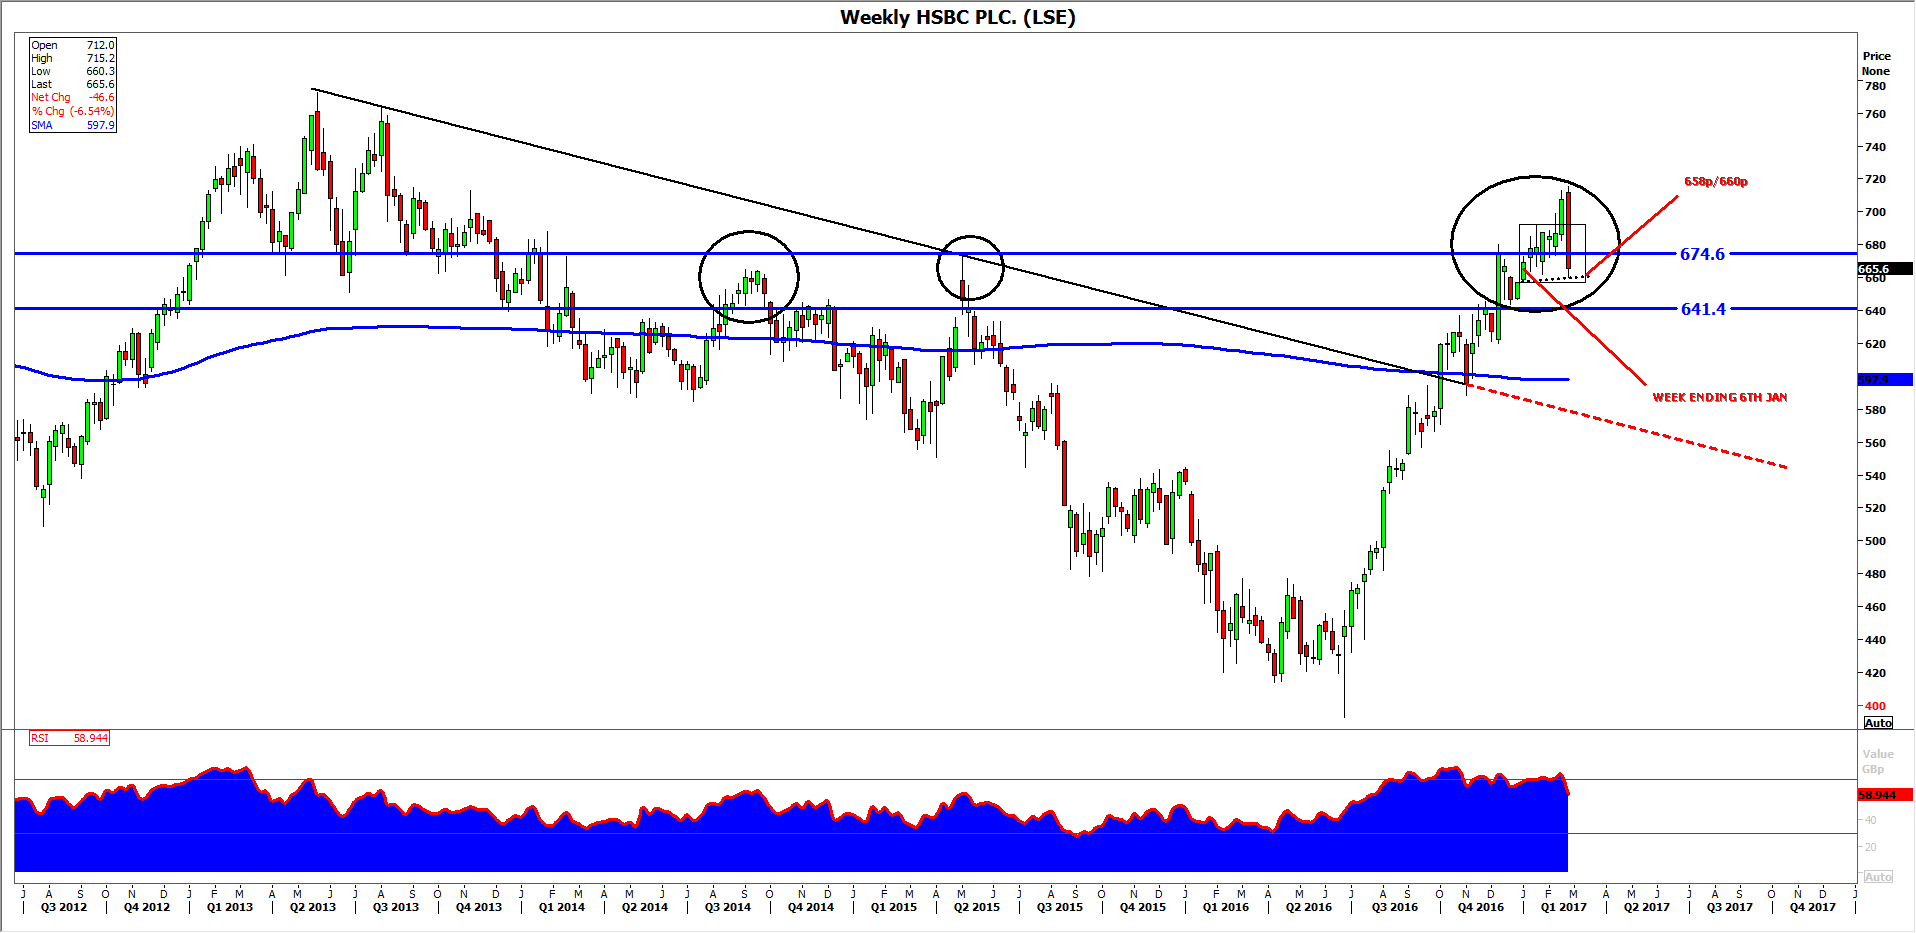
The impact on the group’s shares, from a technical perspective, has brought a renewed focus on their ability to sustain a lead above a clear pivot range between 641p-674p. The range has been an approximate and more recently more accurate support and resistance during several instances of attempted range expansion since 1997. The long-standing importance of the range points to a high likelihood that institutional investor interest frequently gravitates back to those prices.
With the stock’s worst day for around 18 months pushing it squarely back into the range after many investors would have celebrated what appeared to be a definitive upside break, the challenge for buyers now is to mount a strong enough defence of the range. Failure would risk the recurrence of the kind of extended declines seen most recently between May 2015 (during the second quarter, or Q2, of the year in our weekly chart below).
The stock settled on Tuesday off its low of the day of 660p. That is an almost identical price to the low on the 6th January, and points to a degree of support for the medium term at least. Should the support hold, it will go a long way to safeguarding the lower end of the aforementioned range. Should the shorter-term support close to 660p fail to do its job, chances will increase that the negative end of the 641p-674p pivot will come into play followed by a downswing. As we’ve stated such a move risks a significant decline.
WEEKLY CHART: HSBC HOLDINGS PLC.
Source: Thomson Reuters, City Index / please click image to enlarge
StoneX Financial Ltd (trading as “City Index”) is an execution-only service provider. This material, whether or not it states any opinions, is for general information purposes only and it does not take into account your personal circumstances or objectives. This material has been prepared using the thoughts and opinions of the author and these may change. However, City Index does not plan to provide further updates to any material once published and it is not under any obligation to keep this material up to date. This material is short term in nature and may only relate to facts and circumstances existing at a specific time or day. Nothing in this material is (or should be considered to be) financial, investment, legal, tax or other advice and no reliance should be placed on it.
No opinion given in this material constitutes a recommendation by City Index or the author that any particular investment, security, transaction or investment strategy is suitable for any specific person. The material has not been prepared in accordance with legal requirements designed to promote the independence of investment research. Although City Index is not specifically prevented from dealing before providing this material, City Index does not seek to take advantage of the material prior to its dissemination. This material is not intended for distribution to, or use by, any person in any country or jurisdiction where such distribution or use would be contrary to local law or regulation.
For further details see our full non-independent research disclaimer and quarterly summary.
CFDs are complex instruments and come with a high risk of losing money rapidly due to leverage. 69% of retail investor accounts lose money when trading CFDs with this provider. You should consider whether you understand how CFDs work and whether you can afford to take the high risk of losing your money. CFD and Forex Trading are leveraged products and your capital is at risk. They may not be suitable for everyone. Please ensure you fully understand the risks involved by reading our full risk warning.
City Index is a trading name of StoneX Financial Ltd. Head and Registered Office: 1st Floor, Moor House, 120 London Wall, London, EC2Y 5ET. StoneX Financial Ltd is a company registered in England and Wales, number: 05616586. Authorised and regulated by the Financial Conduct Authority. FCA Register Number: 446717.
City Index is a trademark of StoneX Financial Ltd.
The information on this website is not targeted at the general public of any particular country. It is not intended for distribution to residents in any country where such distribution or use would contravene any local law or regulatory requirement.
© City Index 2024