How WTI Has Traded Following Bullish Spikes Of The Past
With oil prices exploding higher yesterday, we take a look at how WTI has performed following similar spikes of volatility.
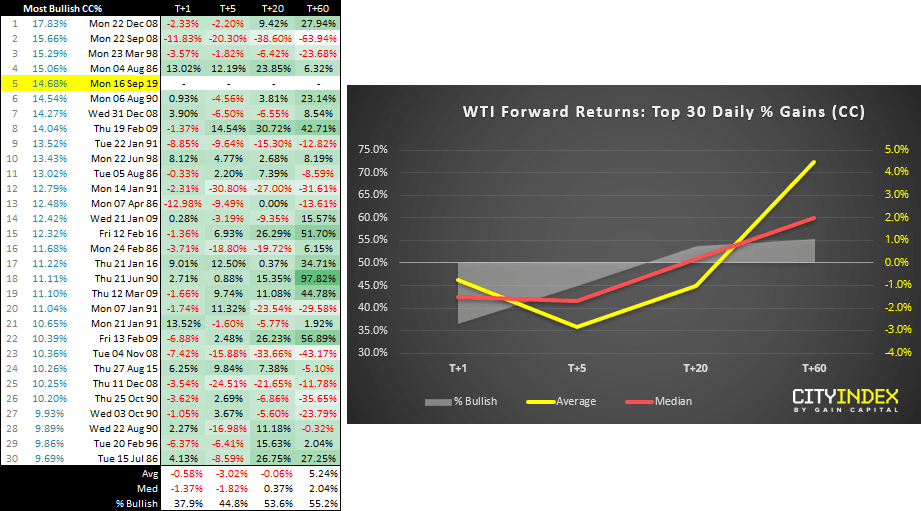
By yesterday’s close, WTI futures enjoyed their 5th most bullish session according to Reuters data going back to December 1984. If prices are to remain elevated, it will surely put an extra strain on growth numbers as costs to consumers and businesses rise, which inadvertently brings along inflation. However, today we’ll look at how WTI prices traded higher levels of bullish volatility.
Please note, the table on the left shows the top 30 bullish days using close to close data, whereas the right hand chart shows the forward returns of the top 30 excluding yesterday’s close (so there will be minor differences between the two, although the underlying analysis remains consistent.
- It appears that bullish spikes don’t necessarily lead to bullish trends over the week following a bullish spike.
- Average returns were also bearish over 50% of the time, one week later.
- 20 days later (around 1 month) shows a positive expectancy for median prices, yet negative on average (so a few outliers have dragged the average down). However, average returns are bullish over 50% of the time.
- Average and median returns are clearly positive three months later, over 50% of the time.
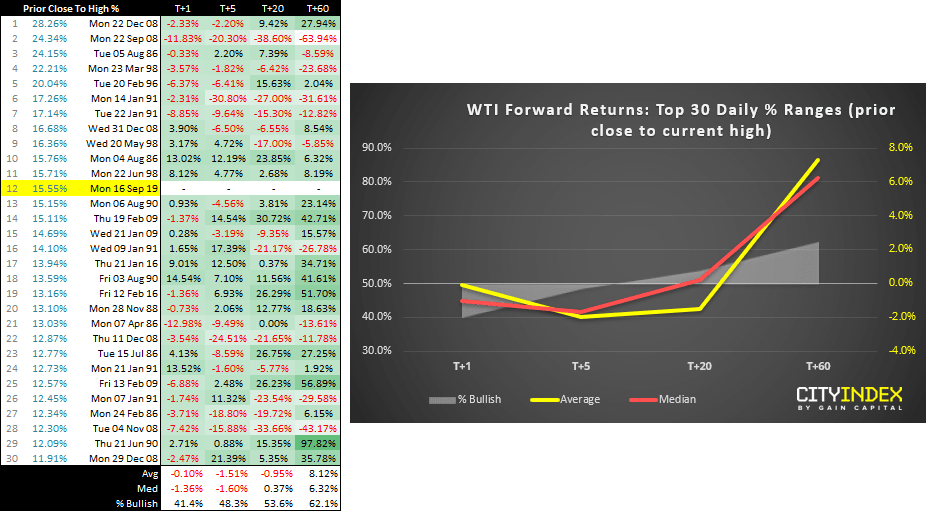
To look at the data in a slightly different light, we measured % gain from the prior close to the daily high. This is to better capture the volatility of the session, along with the initial gap higher. This places yesterday’s rally as the 15th most bullish session from the data set.
- The pattern remains similar, in that average and median returns are negative for up to a week after a bullish spike, whilst also producing bearish returns over 50% of the time.
- There’s a slight positive expectancy on median returns one month later, although average returns are again negative.
- Three months also shows a positive expectancy for average and median returns, over 50% of the time.
From this basic analysis, it appears that that bullish spikes haven’t favoured continued gains over the near-term but could signal a bullish resumption around 3 months later. In some ways this makes sense, as a price shock can lead to confusion and uncertainty, making prices vulnerable to whipsaws and / or retracements.
Related analysis:
Saudi Oil Attacks: WTI levels to watch
Oil ‘supply shock’ in context
WTI Flies High Following A Drone Attack On a Saudi Oil Facility
StoneX Financial Ltd (trading as “City Index”) is an execution-only service provider. This material, whether or not it states any opinions, is for general information purposes only and it does not take into account your personal circumstances or objectives. This material has been prepared using the thoughts and opinions of the author and these may change. However, City Index does not plan to provide further updates to any material once published and it is not under any obligation to keep this material up to date. This material is short term in nature and may only relate to facts and circumstances existing at a specific time or day. Nothing in this material is (or should be considered to be) financial, investment, legal, tax or other advice and no reliance should be placed on it.
No opinion given in this material constitutes a recommendation by City Index or the author that any particular investment, security, transaction or investment strategy is suitable for any specific person. The material has not been prepared in accordance with legal requirements designed to promote the independence of investment research. Although City Index is not specifically prevented from dealing before providing this material, City Index does not seek to take advantage of the material prior to its dissemination. This material is not intended for distribution to, or use by, any person in any country or jurisdiction where such distribution or use would be contrary to local law or regulation.
For further details see our full non-independent research disclaimer and quarterly summary.
CFDs are complex instruments and come with a high risk of losing money rapidly due to leverage. 69% of retail investor accounts lose money when trading CFDs with this provider. You should consider whether you understand how CFDs work and whether you can afford to take the high risk of losing your money. CFD and Forex Trading are leveraged products and your capital is at risk. They may not be suitable for everyone. Please ensure you fully understand the risks involved by reading our full risk warning.
City Index is a trading name of StoneX Financial Ltd. Head and Registered Office: 1st Floor, Moor House, 120 London Wall, London, EC2Y 5ET. StoneX Financial Ltd is a company registered in England and Wales, number: 05616586. Authorised and regulated by the Financial Conduct Authority. FCA Register Number: 446717.
City Index is a trademark of StoneX Financial Ltd.
The information on this website is not targeted at the general public of any particular country. It is not intended for distribution to residents in any country where such distribution or use would contravene any local law or regulatory requirement.
© City Index 2024