Historically How Bearish Has A Bearish Outside Week Been On The ASX200
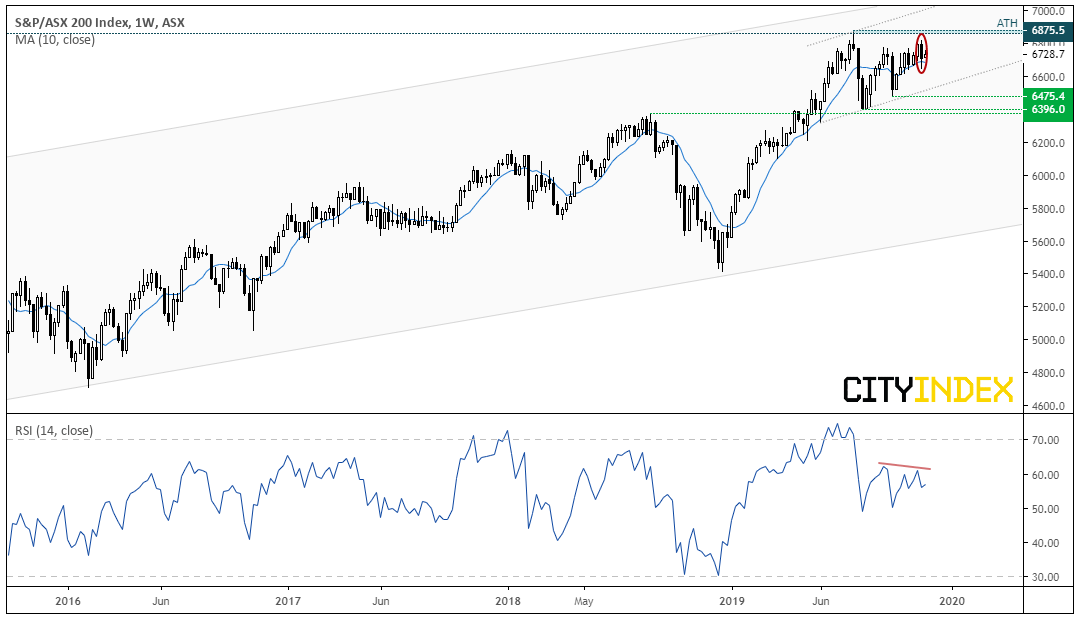
By Friday’s close, the ASX200 had produced a bearish outside week after failing to hold above 6,800 which raises the potential for some mean reversion. Given the slight bearish divergence forming with RSI and the clear loss of momentum leading it back towards its all-time high, we explore the bearish potential of this classic candlestick pattern to see if it can pull the rug from under Santa’s rally in December.
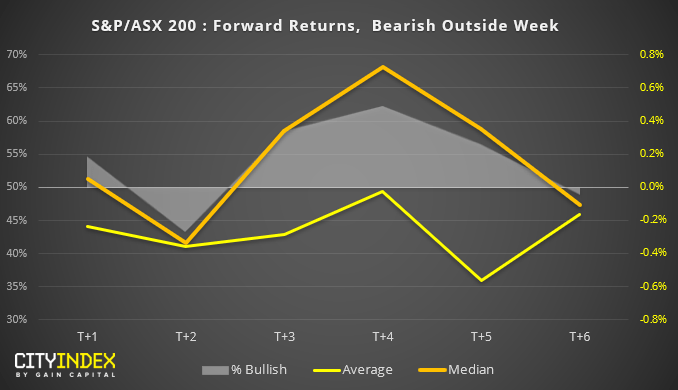
The test: Using Reuters data since April 2000, we filtered all bearish outside candles on the weekly chart. We have then calculated forward returns following a bearish outside candle, along with the % of bullish closes of the forward returns.
As we’re testing a bearish pattern, ideally we’d want to see negative returns with a % bullish rate below 50%.
- The week following a bearish outside candle tends to close higher more often than not and median returns are also positive, whilst average returns are negative (currently the ASX200 is trading higher this week but we’ll see how this plays out).
- From this data set, 2 weeks after a bearish outside week has produced the most bearish average and median returns, with the highest success rate (as they only close higher on 43.4% of the times). Also note that median returns are also negative suggesting the results are more consistent. Whilst average returns are larger 5 weeks out, it clearly diverges with median returns to show that outliers have weighed this average down.
- Whilst average returns are negative between 1-6 weeks after the pattern, median returns (or typical returns) are positive and close higher over 50% of the time. This suggests a few outliers have pushed average returns into negative territory, yet they typically close higher more often than not.
However, as this filters all bearish outside candles, trend direction has not been considered. So next we apply a rule where the pattern must close above or below its 10-week average to denote a basic trend filter.
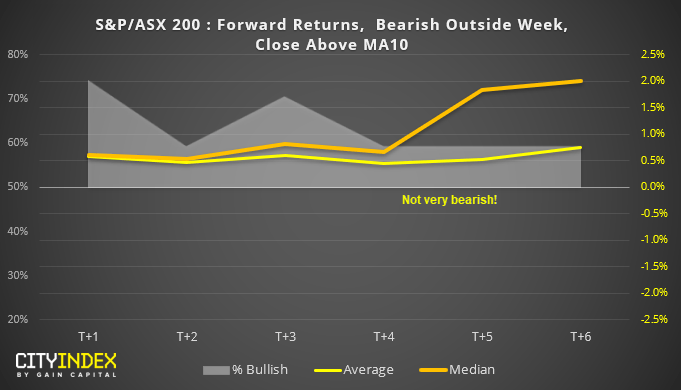
Bearish outside day with a close above its 10-week MA
- In short, not very bearish at all.
- Average and median returns are positive between 1 to 6 weeks later, and all have a positive expectancy with % bullish above zero.
- It’s interesting to note that median returns accelerate 5-6 weeks later
- The week after the pattern (or this week) has a % bullish rate of 75%!
- However, there are only 27 instances of this occurring since 2000 (generally its good practice to have a minimum of 30 occurrences).
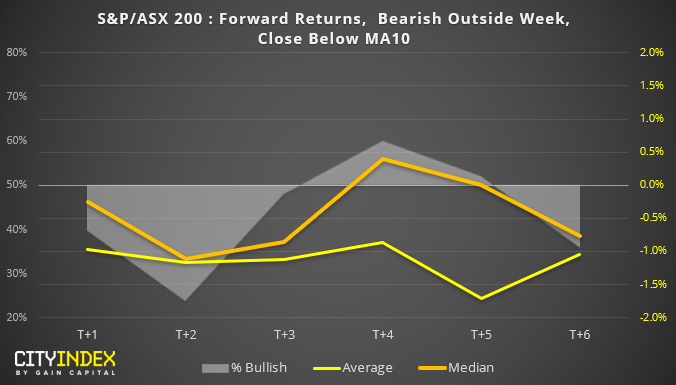
Bearish outside day with a close below its 10-week MA
- That’s a bit more like it…
- Again we see +2 weeks as optimal to bears, as both average and median returns are bearish. Moreover, bullish closes are just 24% which means it has closed lower 76% of the time.
- The relationship breaks down around 4 weeks later as median returns are positive over 50% of the time.
- Ultimately, it has been better at picking near-term reversals over longer-term ones.
- However, there are only 25 instances of this occurring since 2000 which is below the ideal sample of 30 or above.
Final thoughts:
- Two weeks after a bearish engulfing candle appears optimum for bears, unless it has closed above its 10-week MA. (take note, the ASX200 closed above its 10-week MA last week).
- Moreover, with average, median and % of bullish closes all positive up to 6 weeks after the bearish outside week closes above its 10-week MA, it appears to be more of a bear-trap signal if anything.
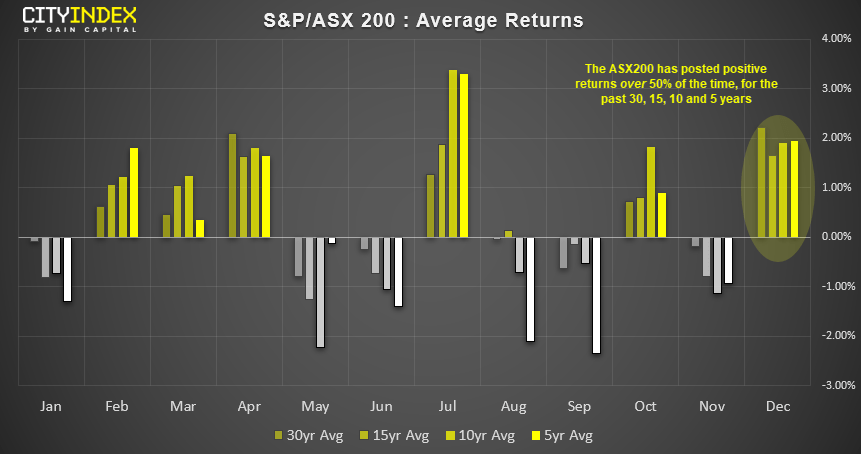
- Moreover, December has historically been the most bullish month of the year for the ASX200. Average returns are over 2% over the past 30 years, and it has also posted positive average returns over 50% of the time over the past 30, 15, 10 and 5 years.
- Given its tendency to rally in December and post positive returns if a bearish engulfing candle closes above its 10-week average, the ASX200 could still rally over the next few weeks.
Related Analysis (City Index):
ASX200: The Long And Short Of It | NAN, GXY, REA, BPT
Weekly and Monthly Bearish Engulfing Candles Appear On DXY - But Just How Grizzly Are They?
How WTI Has Traded Following Bullish Spikes Of The Past
Forward Returns Following A US10-2 Year Inversion
Bitcoin: Do Volatile Bullish Sessions Lead To Further Gains?
StoneX Financial Ltd (trading as “City Index”) is an execution-only service provider. This material, whether or not it states any opinions, is for general information purposes only and it does not take into account your personal circumstances or objectives. This material has been prepared using the thoughts and opinions of the author and these may change. However, City Index does not plan to provide further updates to any material once published and it is not under any obligation to keep this material up to date. This material is short term in nature and may only relate to facts and circumstances existing at a specific time or day. Nothing in this material is (or should be considered to be) financial, investment, legal, tax or other advice and no reliance should be placed on it.
No opinion given in this material constitutes a recommendation by City Index or the author that any particular investment, security, transaction or investment strategy is suitable for any specific person. The material has not been prepared in accordance with legal requirements designed to promote the independence of investment research. Although City Index is not specifically prevented from dealing before providing this material, City Index does not seek to take advantage of the material prior to its dissemination. This material is not intended for distribution to, or use by, any person in any country or jurisdiction where such distribution or use would be contrary to local law or regulation.
For further details see our full non-independent research disclaimer and quarterly summary.
CFDs are complex instruments and come with a high risk of losing money rapidly due to leverage. 69% of retail investor accounts lose money when trading CFDs with this provider. You should consider whether you understand how CFDs work and whether you can afford to take the high risk of losing your money. CFD and Forex Trading are leveraged products and your capital is at risk. They may not be suitable for everyone. Please ensure you fully understand the risks involved by reading our full risk warning.
City Index is a trading name of StoneX Financial Ltd. Head and Registered Office: 1st Floor, Moor House, 120 London Wall, London, EC2Y 5ET. StoneX Financial Ltd is a company registered in England and Wales, number: 05616586. Authorised and regulated by the Financial Conduct Authority. FCA Register Number: 446717.
City Index is a trademark of StoneX Financial Ltd.
The information on this website is not targeted at the general public of any particular country. It is not intended for distribution to residents in any country where such distribution or use would contravene any local law or regulatory requirement.
© City Index 2024