High bling low dollars lift London shares
The best performing share on London’s large-cap market will be no surprise to traders who dived into Lonmin in recent months.
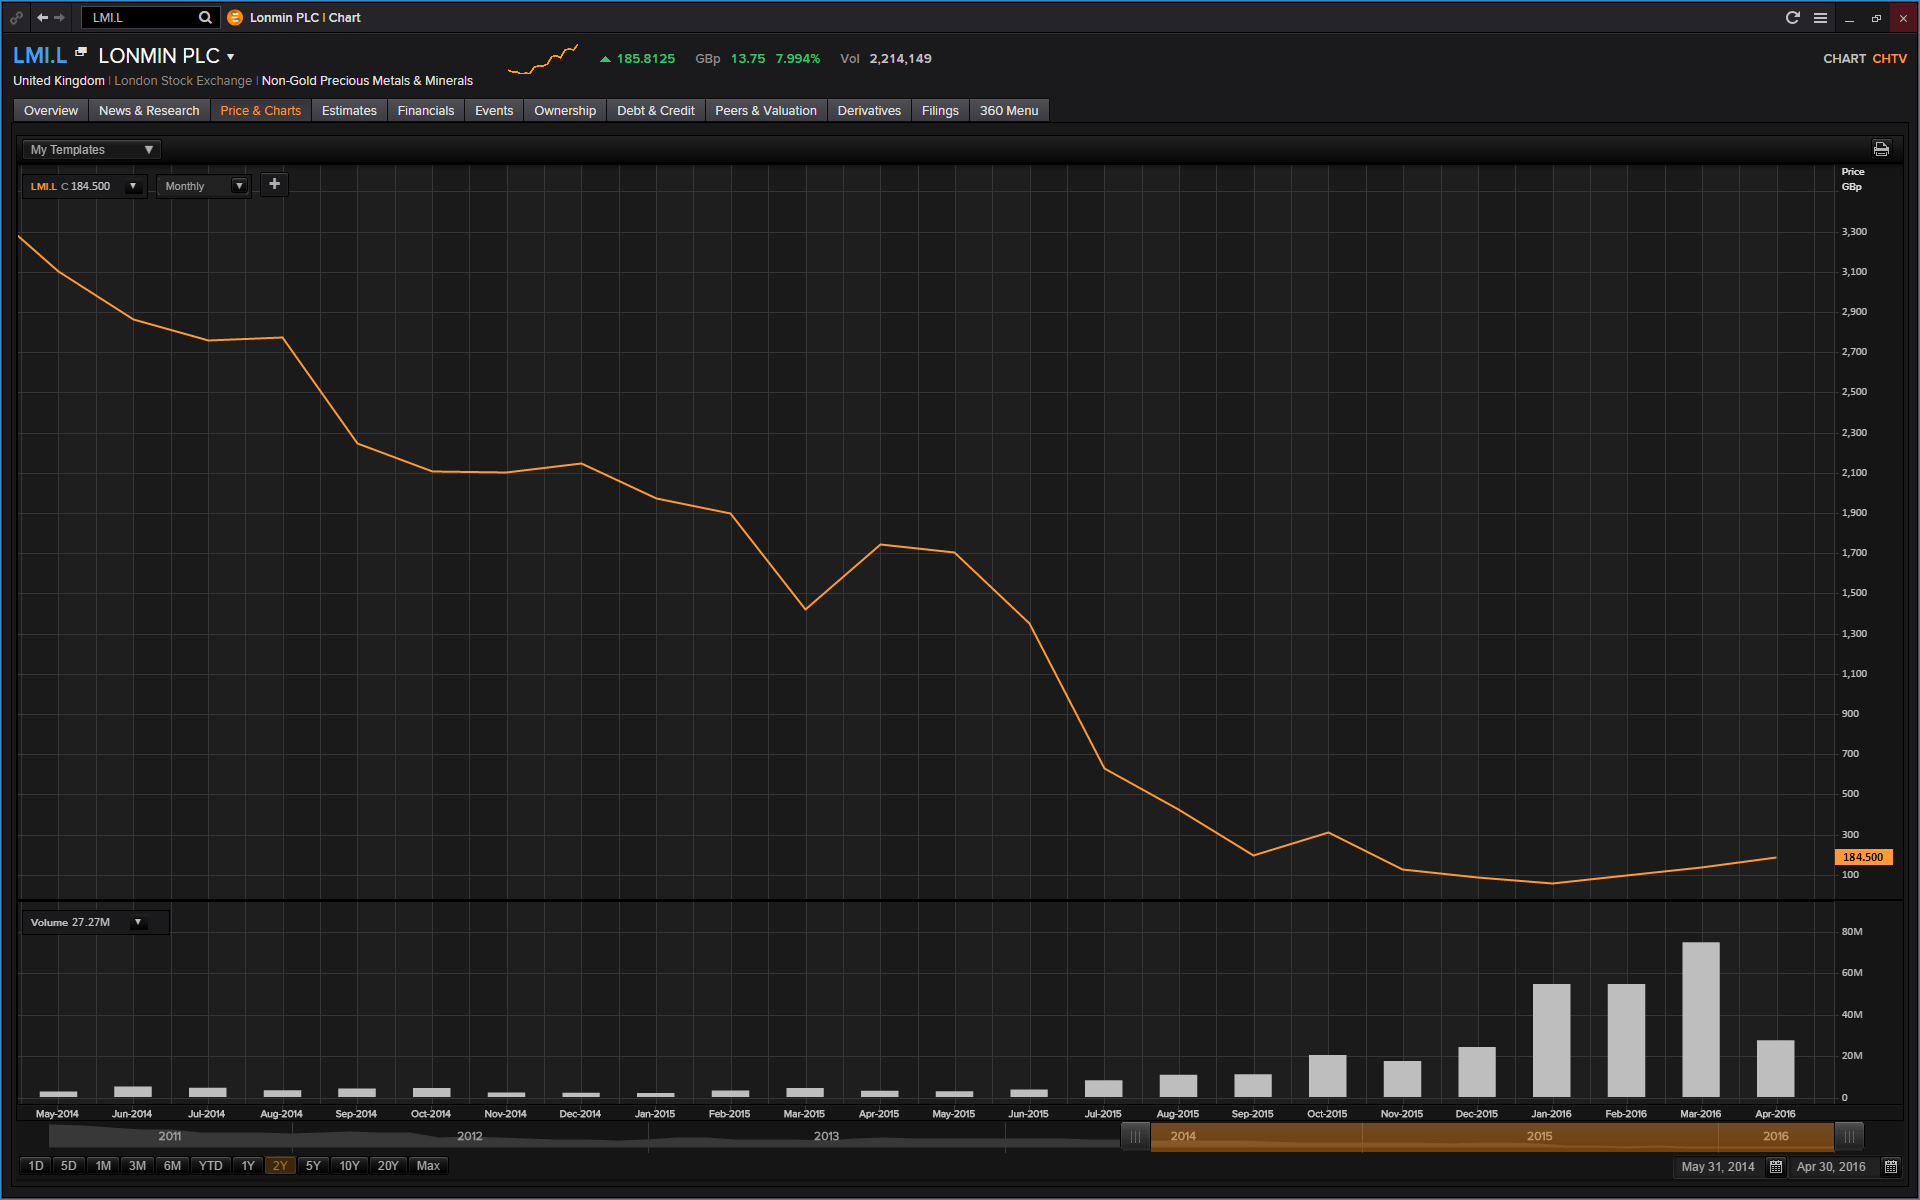
The chart below shows monthly volume in the name has surged well above the typical levels seen since 2004.
MONTHLY CHART: LONMIN TRADING VOLUME SINCE MAY 2014
Please click image to enlarge
Holders of Lonmin—the Anglo-South African miner with a storied history and tumultuous recent past—are sitting on a 340% three-month gain.
That would be remarkable even under the best market circumstances and certainly reflects a bounce by western stock indices that took many investors by surprise, considering the troubling start to the year for global shares.
But Lonmin is not the only triple-digit percentage gainer over the last few months.
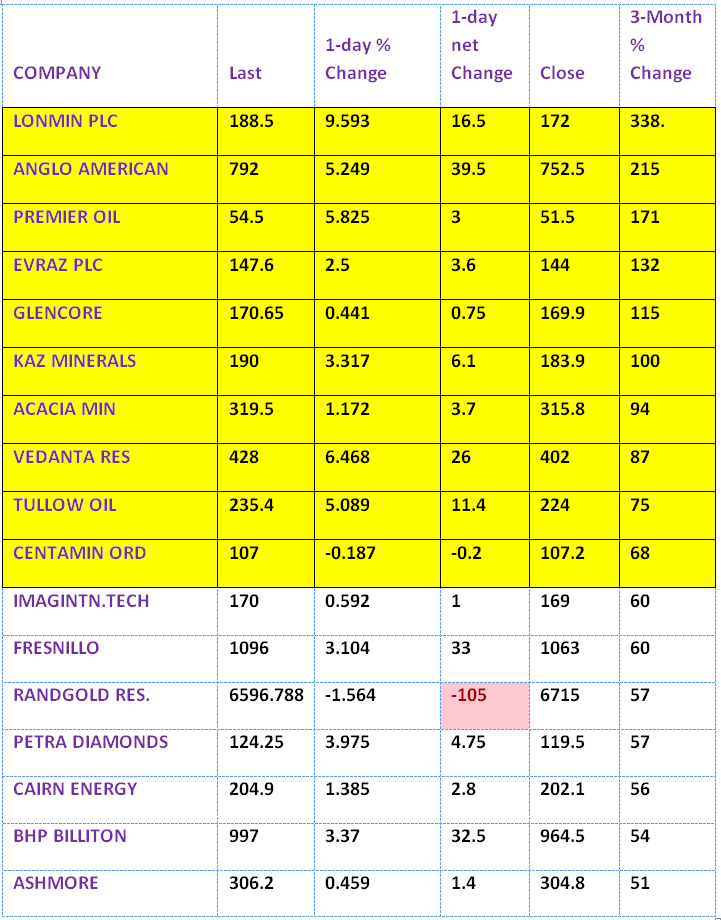
A quick glance down the list of the FTSE 350’s best shares shows the Top 10 are all miners and oil producers.
Leaving aside Imagination Technologies, which is being propelled by its latest bout of M&A speculation, we have to go another 6 places lower before we find the next non-mineral dependent stock.
(It is emerging markets investment manager Ashmore, so not entirely countertrend.)
MINERS AND OIL COMPANIES LIFT LONDON MARKET
Prices and data as of Wednesday’s close
Bling and dollars
There’s little mystery as to why these shares have roared ahead.
After commodity prices thudded to five-year lows last August, turbo charged by a stock market collapse in China, even the most relative of bounces was likely to be cheered.
And even taking into account near-chronic backwardation—where nearby prices are higher than those further out on the curve—commodity price action has been fairly orderly and even steady in recent months.
The US dollar—in which most resource trade takes place—having its worst quarter for 5-years (as the Dollar Index) was also a key tailwind for commodities.
Thomson Reuters’ Core Commodity Index has risen about 12% since mid-February, and oil prices have been just short of notorious, with US crude and Brent up 55%-60%.
With most of the names in our table trading below net asset value for months, the commodity comeback was almost bound to start a fire, fuelling a string of 2016 highs for the oil and mining biased FTSE 100 this week.
The obvious question is: are gains by diggers and drillers likely to fizzle out soon or run even further?
We attempt to answer that question in part 2 of this article.
StoneX Financial Ltd (trading as “City Index”) is an execution-only service provider. This material, whether or not it states any opinions, is for general information purposes only and it does not take into account your personal circumstances or objectives. This material has been prepared using the thoughts and opinions of the author and these may change. However, City Index does not plan to provide further updates to any material once published and it is not under any obligation to keep this material up to date. This material is short term in nature and may only relate to facts and circumstances existing at a specific time or day. Nothing in this material is (or should be considered to be) financial, investment, legal, tax or other advice and no reliance should be placed on it.
No opinion given in this material constitutes a recommendation by City Index or the author that any particular investment, security, transaction or investment strategy is suitable for any specific person. The material has not been prepared in accordance with legal requirements designed to promote the independence of investment research. Although City Index is not specifically prevented from dealing before providing this material, City Index does not seek to take advantage of the material prior to its dissemination. This material is not intended for distribution to, or use by, any person in any country or jurisdiction where such distribution or use would be contrary to local law or regulation.
For further details see our full non-independent research disclaimer and quarterly summary.
CFDs are complex instruments and come with a high risk of losing money rapidly due to leverage. 69% of retail investor accounts lose money when trading CFDs with this provider. You should consider whether you understand how CFDs work and whether you can afford to take the high risk of losing your money. CFD and Forex Trading are leveraged products and your capital is at risk. They may not be suitable for everyone. Please ensure you fully understand the risks involved by reading our full risk warning.
City Index is a trading name of StoneX Financial Ltd. Head and Registered Office: 1st Floor, Moor House, 120 London Wall, London, EC2Y 5ET. StoneX Financial Ltd is a company registered in England and Wales, number: 05616586. Authorised and regulated by the Financial Conduct Authority. FCA Register Number: 446717.
City Index is a trademark of StoneX Financial Ltd.
The information on this website is not targeted at the general public of any particular country. It is not intended for distribution to residents in any country where such distribution or use would contravene any local law or regulatory requirement.
© City Index 2024