Has USD JPY bottomed out
This week has seen the USD/JPY stage a remarkable recovery. After dipping momentarily below 100 on Friday of last week, the unit has climbed some 600 pips to reach a high so far of almost 106.00 today.
The rebound has been driven by speculation about a potential Bank of Japan intervention of some sort, a general enhancement in risk appetite and a slight improvement in US data.
Last Friday’s stronger employment report for the month of June was followed today by better-than-expected readings for US weekly unemployment claims (254K vs. 263K expected) and the Producer Price Index (+0.5% m/m vs. +0.3% expected).
Tomorrow will perhaps be the most important day of the week for the dollar as we will have the latest Consumer Price Index (CPI) measure of inflation, retail sales for the month of June and the closely-followed gauge of consumer sentiment from the University of Michigan. Headline and core CPI for June are both expected to come in at +0.2% m/m following similar readings in May. Headline retail sales are seen rising 0.1% while core sales are expected to come in at 0.4%. Meanwhile the UoM Consumer Sentiment index is expected to show little improvement from last month’s 93.5 showing.
Ahead of all this, China will be publishing some important data of its own in the early hours of Friday: second quarter GDP and monthly snapshot of retail sales, industrial production and fixed asset investment, all for the month of June. Growth at the world’s second largest economy is expected to have moderated further in Q2, to 6.6% from 6.7% in Q1 compared to the same quarter of last year. Likewise, industrial production, fixed asset investment and retail sales are all expected to have moderated from their prior readings.
So, the outcome of the abovementioned data on Friday will have an impact on the direction of the USD/JPY, especially if they show significant deviations from expectations. Given the extent of this week’s rally, traders are likely to put more weight behind weaker numbers as they will look for any excuse to book profit. Meanwhile the US stock markets appear to be severely overbought in the short-term outlook and if we see a small correction here then this too may add some downward pressure on the positively-correlating USD/JPY.
Obviously the opposite is also true and as you will see below, I am leaning more towards the bullish side of the argument, even though the USD/JPY has reached a potential resistance area which could lead to some short-term downward pressure.
Technical outlook
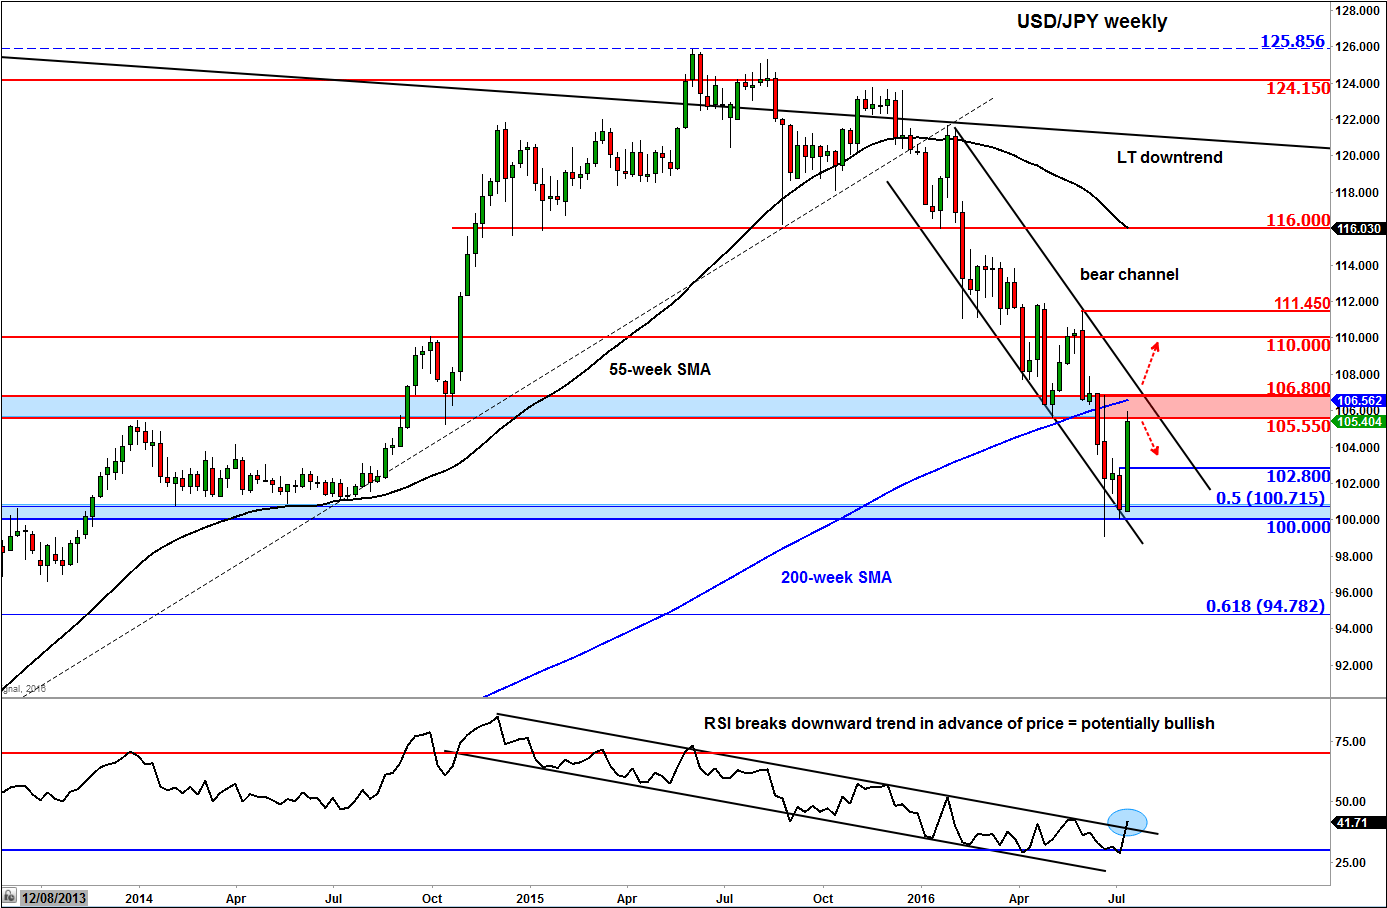
The USD/JPY has indeed reached a major technical area around 105.55-106.80. As can be seen from the weekly chart, below, this area was previously support and resistance. The upper end of this range is where the 200-week moving average converges with the top of the bearish channel. For these reasons alone you would expect to see a pullback of some sort here. While that seems to be the logical expectation and we may well get a reaction there, I can’t help but feel the USD/JPY will eventually slice through this area before extending its advance.
It appears as though there is plenty of momentum behind this rally, with the rest of the JPY pairs also showing some reversal signs in recent days. Added to this, the US equity indices have surged to fresh record levels and the USD/JPY being a risk-sensitive FX pair – which tends to correlate positively with the stock markets – it could break higher, too.
What’s more, the USD/JPY has already staged a significant pullback following its big multi-year rally, so it could be ready to start climbing higher once again as some investors will no doubt think that the unit has fallen below its fundamental value. The pullback to the 50% retracement level (100.70) and the re-test of, and subsequent rejection at, prior support and psychological level of 100 are additional reasons why we may see a bigger bounce. Meanwhile the Relative Strength Index (RSI) has already broken out of its own corresponding channel in advance of price doing the same. So, could the USD/JPY follow suit now?
StoneX Financial Ltd (trading as “City Index”) is an execution-only service provider. This material, whether or not it states any opinions, is for general information purposes only and it does not take into account your personal circumstances or objectives. This material has been prepared using the thoughts and opinions of the author and these may change. However, City Index does not plan to provide further updates to any material once published and it is not under any obligation to keep this material up to date. This material is short term in nature and may only relate to facts and circumstances existing at a specific time or day. Nothing in this material is (or should be considered to be) financial, investment, legal, tax or other advice and no reliance should be placed on it.
No opinion given in this material constitutes a recommendation by City Index or the author that any particular investment, security, transaction or investment strategy is suitable for any specific person. The material has not been prepared in accordance with legal requirements designed to promote the independence of investment research. Although City Index is not specifically prevented from dealing before providing this material, City Index does not seek to take advantage of the material prior to its dissemination. This material is not intended for distribution to, or use by, any person in any country or jurisdiction where such distribution or use would be contrary to local law or regulation.
For further details see our full non-independent research disclaimer and quarterly summary.
CFDs are complex instruments and come with a high risk of losing money rapidly due to leverage. 69% of retail investor accounts lose money when trading CFDs with this provider. You should consider whether you understand how CFDs work and whether you can afford to take the high risk of losing your money. CFD and Forex Trading are leveraged products and your capital is at risk. They may not be suitable for everyone. Please ensure you fully understand the risks involved by reading our full risk warning.
City Index is a trading name of StoneX Financial Ltd. Head and Registered Office: 1st Floor, Moor House, 120 London Wall, London, EC2Y 5ET. StoneX Financial Ltd is a company registered in England and Wales, number: 05616586. Authorised and regulated by the Financial Conduct Authority. FCA Register Number: 446717.
City Index is a trademark of StoneX Financial Ltd.
The information on this website is not targeted at the general public of any particular country. It is not intended for distribution to residents in any country where such distribution or use would contravene any local law or regulatory requirement.
© City Index 2024