Golden times ahead for the yellow precious metal
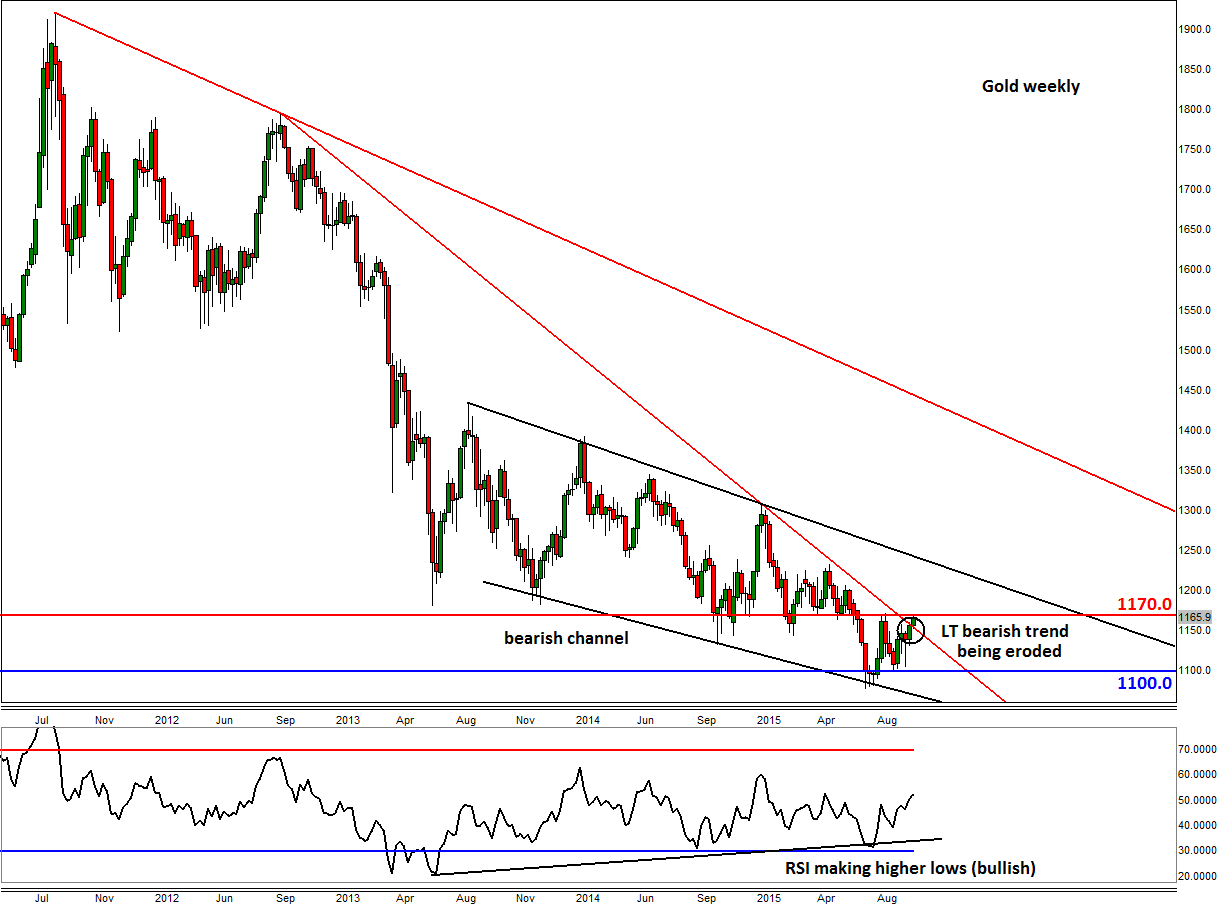
Unlike crude oil, gold has been able to hold its own pretty well so far this week. At the time of this writing on Tuesday evening, the precious metal was trading around $1165 per troy ounce after recovering its earlier losses. It was thus 5 bucks shy of the key short-term resistance and August high at $1170.
The precious metal is continuing to benefit from the weakness in US dollar and safe haven buying due to growing uncertainty about the direction of the stock markets. The US earnings season is about to kick into a higher gear this week with the major Wall Street banks reporting their quarterly results over the next few days; the fear is that the banks and other US companies may disappoint the already-low expectations. Meanwhile concerns over the health of the Chinese economy may also undermine risk appetite after the latest trade figures showed imports at the world’s second largest economy fell more than 20% year-over-year in September. In addition, gold has caught the attention of momentum speculative buyers after the precious metal broke above a key resistance level and a long-term downward-sloping trend line around $1140 last week; this is technical bullish development.
So, as things stand gold is shining brightly and looks like it wants to push further higher this week, US data permitting. Although there wasn’t much in the way of US macroeconomic data on Tuesday, things should pick up from Wednesday onwards when we will have the latest retail sales and PPI figures. Thursday will see the release of the monthly headline and core CPI estimates; the Empire State and Philly Fed manufacturing indices, and the usual weekly unemployment claims figures. Friday’s key macro data will include the UoM Consumer Sentiment, JOLTS Job Openings, Industrial Production and Capacity Utilization Rate. So, there will be plenty of data this week to hopefully provide clear direction for the dollar and in turn the buck-denominated precious metal.
From a technical perspective, the break of the long-term trend line is clearly a bullish development for gold (see the weekly chart). That being said, the precious metal still resides within a bearish channel, and will remain inside it even if it goes on to break above the short-term resistance at $1170. Nevertheless, the potential break above $1170 could at least lead to some further short-term gains, and who knows it could even mark the start of a major bullish trend. For the time being though, the bulls should proceed with extra caution and should avoid the temptation to project their expectations about the direction of prices too far out, as this can be quite dangerous and lead to all sorts of problems down the line. Many times traders fail to do what is in their own best interest because price action simply does not follow the path they had envisaged at the time when they first placed their trades.
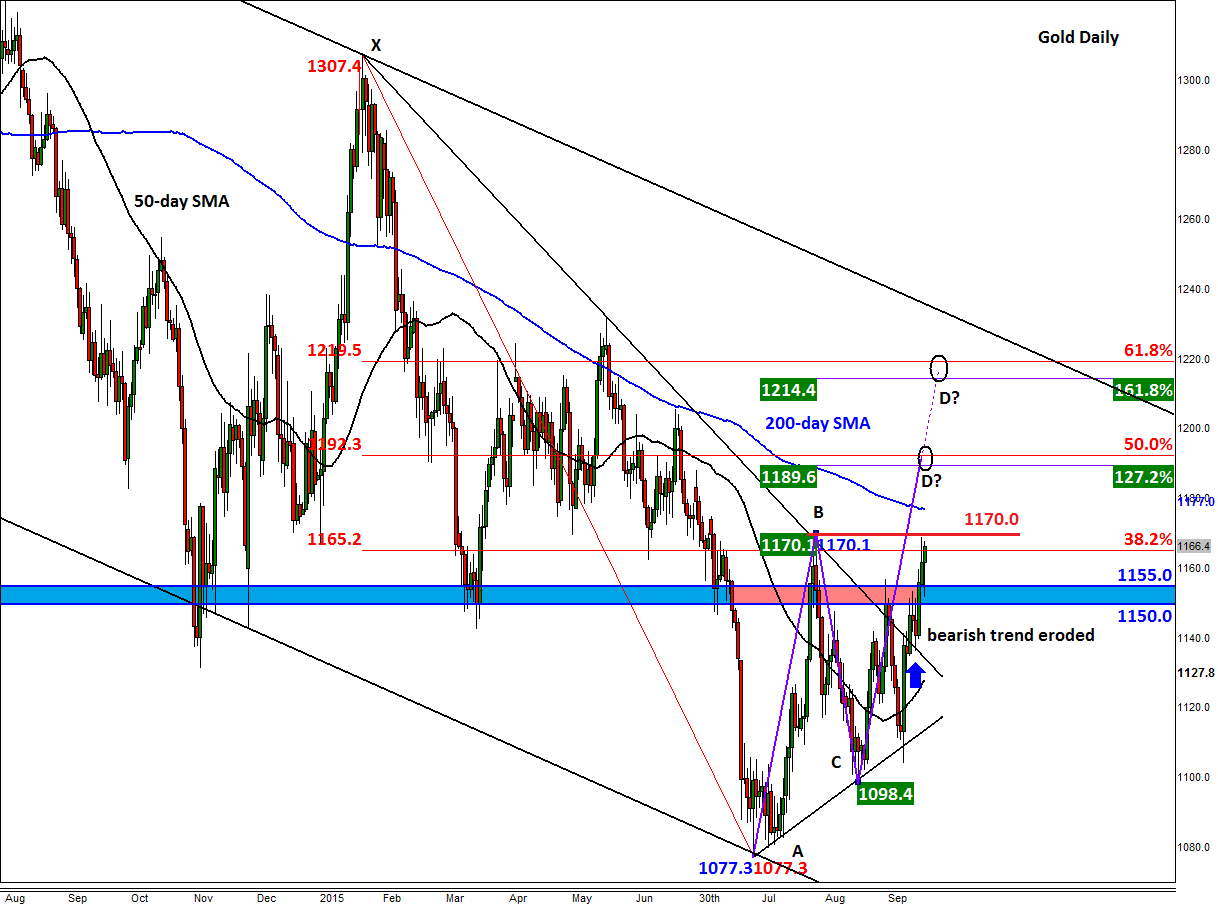
A potential break above the noted $1170 resistance level, especially on a daily closing basis, could see the metal go for the 200-day moving average at $1177 at the very least and possibly even the Fibonacci convergence levels around $1189/92 and then $1214/20 (these areas are circled on the daily chart). The resistance trend of the long-term bearish channel would also come in around the $1220 level, depending on the speed of the potential rally. Meanwhile this bullish technical outlook will become invalid upon a decisive break back below the $1150 handle. In this scenario, gold may then drop back towards its 50-day SMA, currently at $1128, before deciding on its next move.
StoneX Financial Ltd (trading as “City Index”) is an execution-only service provider. This material, whether or not it states any opinions, is for general information purposes only and it does not take into account your personal circumstances or objectives. This material has been prepared using the thoughts and opinions of the author and these may change. However, City Index does not plan to provide further updates to any material once published and it is not under any obligation to keep this material up to date. This material is short term in nature and may only relate to facts and circumstances existing at a specific time or day. Nothing in this material is (or should be considered to be) financial, investment, legal, tax or other advice and no reliance should be placed on it.
No opinion given in this material constitutes a recommendation by City Index or the author that any particular investment, security, transaction or investment strategy is suitable for any specific person. The material has not been prepared in accordance with legal requirements designed to promote the independence of investment research. Although City Index is not specifically prevented from dealing before providing this material, City Index does not seek to take advantage of the material prior to its dissemination. This material is not intended for distribution to, or use by, any person in any country or jurisdiction where such distribution or use would be contrary to local law or regulation.
For further details see our full non-independent research disclaimer and quarterly summary.
CFDs are complex instruments and come with a high risk of losing money rapidly due to leverage. 69% of retail investor accounts lose money when trading CFDs with this provider. You should consider whether you understand how CFDs work and whether you can afford to take the high risk of losing your money. CFD and Forex Trading are leveraged products and your capital is at risk. They may not be suitable for everyone. Please ensure you fully understand the risks involved by reading our full risk warning.
City Index is a trading name of StoneX Financial Ltd. Head and Registered Office: 1st Floor, Moor House, 120 London Wall, London, EC2Y 5ET. StoneX Financial Ltd is a company registered in England and Wales, number: 05616586. Authorised and regulated by the Financial Conduct Authority. FCA Register Number: 446717.
City Index is a trademark of StoneX Financial Ltd.
The information on this website is not targeted at the general public of any particular country. It is not intended for distribution to residents in any country where such distribution or use would contravene any local law or regulatory requirement.
© City Index 2024