Golden retreat gaining momentum
On that note, it is the COVID-19 recovery that continues to hold global market attention. Supported by a run of better than expected economic data last week that included U.S. ISM manufacturing and a sharp rise in nonfarm employment (2.5 million verse expectations for an 8 million decrease). A combination that awoke U.S. 10 year yields from their six-week slumber, to close almost 25bp higher on the week at 0.90%.
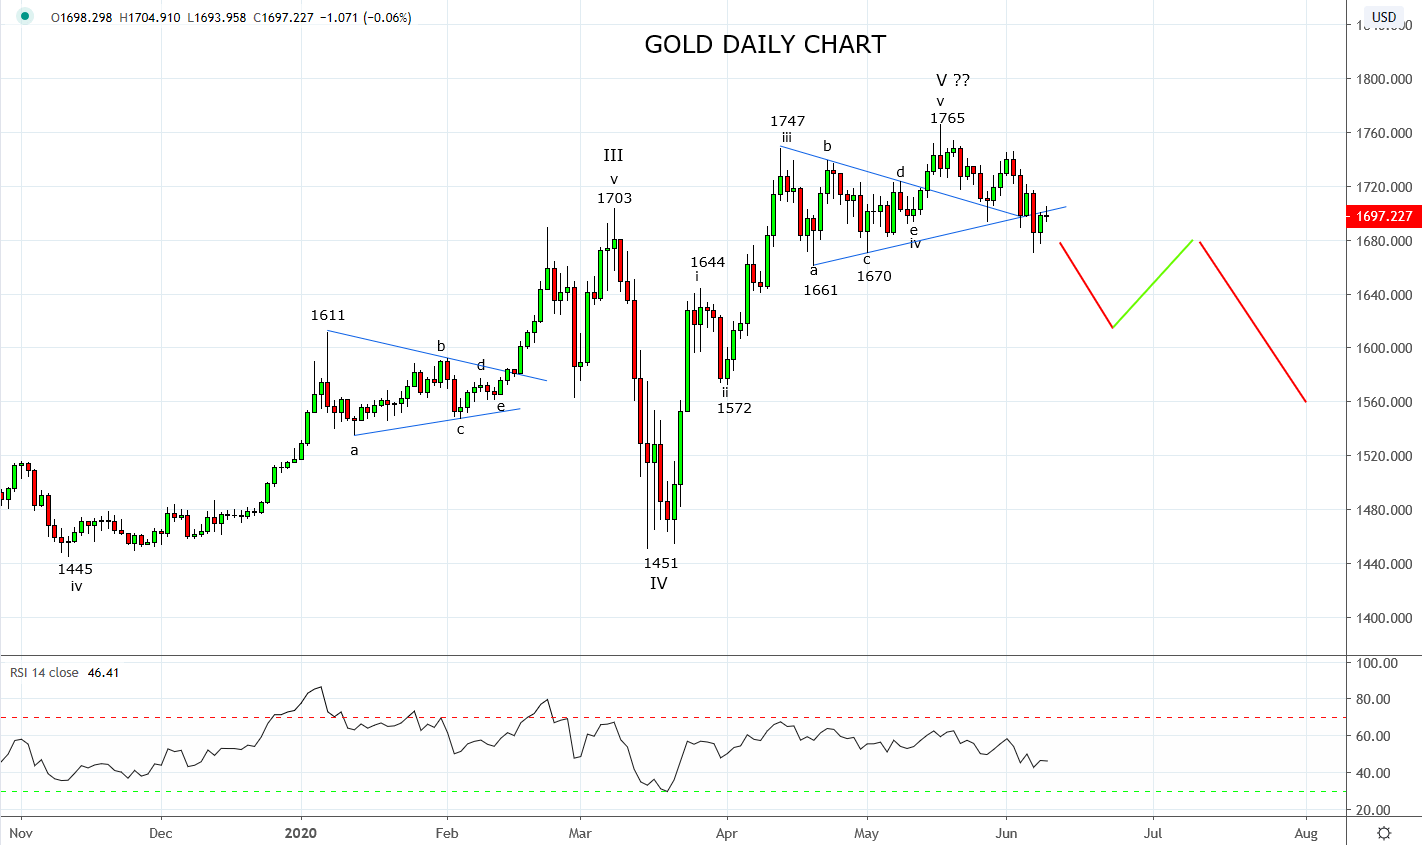
The sharp and earlier than expected rise in yields is likely to have future implications across markets, probably in the equity space but its impact was immediately visible against gold. As highlighted in the past, gold and U.S. 10 year yields are negatively correlated and last week’s rise in yields coincided with a $45.00 fall in the price of gold, back to the U.S.$1685.00 area.
The fall was in line with a warning we included in our last article on gold on the 22nd of May here shortly after gold traded to its $1765 high.
“This raises the possibility that if gold has completed a 5-wave rally at this week’s $1765 high, it is on the verge of a significant corrective pullback. At the minimum, the bearish divergence viewed on the RSI indicator on the daily chart warns that upside momentum is falling and a valid reason to tighten up stops on long gold positions.”
While we will need to keep an eye on U.S. 10 year yields to see if they will consolidate the break higher, from a purely technical perspective, golds move below trendline support at $1694 provides a strong indication that the significant pullback mentioned above is underway, broadly into the $1550/1450 region. Confidence in this view builds on a break of the April 21st, $1661 low.
From a trading perspective, should the pullback play out as anticipated in the coming weeks and with the macro medium term picture remaining supportive, a decline in price would be viewed as an opportunity to rebuild gold longs in anticipation of the next leg higher.
Source Tradingview. The figures stated areas of the 9th of June 2020. Past performance is not a reliable indicator of future performance. This report does not contain and is not to be taken as containing any financial product advice or financial product recommendation
StoneX Financial Ltd (trading as “City Index”) is an execution-only service provider. This material, whether or not it states any opinions, is for general information purposes only and it does not take into account your personal circumstances or objectives. This material has been prepared using the thoughts and opinions of the author and these may change. However, City Index does not plan to provide further updates to any material once published and it is not under any obligation to keep this material up to date. This material is short term in nature and may only relate to facts and circumstances existing at a specific time or day. Nothing in this material is (or should be considered to be) financial, investment, legal, tax or other advice and no reliance should be placed on it.
No opinion given in this material constitutes a recommendation by City Index or the author that any particular investment, security, transaction or investment strategy is suitable for any specific person. The material has not been prepared in accordance with legal requirements designed to promote the independence of investment research. Although City Index is not specifically prevented from dealing before providing this material, City Index does not seek to take advantage of the material prior to its dissemination. This material is not intended for distribution to, or use by, any person in any country or jurisdiction where such distribution or use would be contrary to local law or regulation.
For further details see our full non-independent research disclaimer and quarterly summary.
CFDs are complex instruments and come with a high risk of losing money rapidly due to leverage. 69% of retail investor accounts lose money when trading CFDs with this provider. You should consider whether you understand how CFDs work and whether you can afford to take the high risk of losing your money. CFD and Forex Trading are leveraged products and your capital is at risk. They may not be suitable for everyone. Please ensure you fully understand the risks involved by reading our full risk warning.
City Index is a trading name of StoneX Financial Ltd. Head and Registered Office: 1st Floor, Moor House, 120 London Wall, London, EC2Y 5ET. StoneX Financial Ltd is a company registered in England and Wales, number: 05616586. Authorised and regulated by the Financial Conduct Authority. FCA Register Number: 446717.
City Index is a trademark of StoneX Financial Ltd.
The information on this website is not targeted at the general public of any particular country. It is not intended for distribution to residents in any country where such distribution or use would contravene any local law or regulatory requirement.
© City Index 2024