Gold Will 1135 be a reflection point or an inflection point
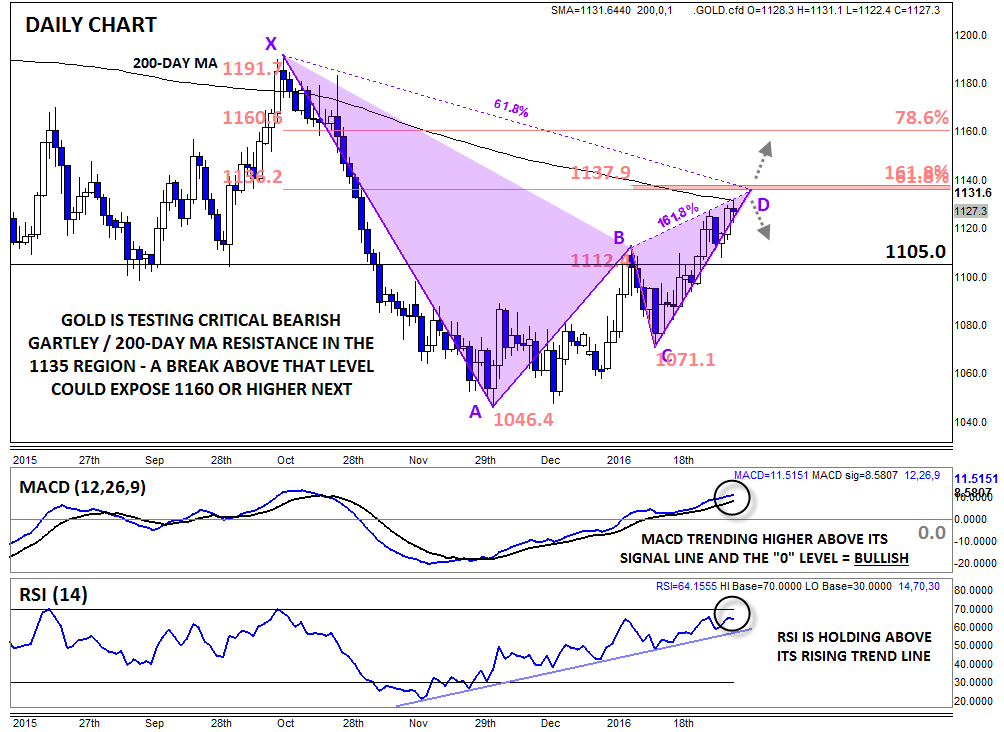
Late last week, we highlighted a rounded bottom pattern in gold, concluding that “the short-term bias in gold points higher as long as the yellow metal remains above the key 1100-1110 zone. To the topside, the key levels to watch in the coming week will be the 200-day MA at 1130, followed by the 61.8% and 78.6% Fibonacci retracements of the Oct-Nov drop at 1135 and 1160, respectively.“ After a decent rally Monday, the first resistance level has already been reached, and the more we look at it, the more significant that barrier becomes.
Most importantly, the 1130-35 range represents the completion of a clear Bearish “222” Gartley pattern. This geometric pattern is named after the author (H.M. Gartley) and page number (222) of the first book to describe it (Profits in the Stock Market) way back in 1935. In essence, it helps traders identify higher-probability turning points in the market from the convergence of multiple resistance levels.
In this case, at least four significant levels all converge around 1135 on gold:
- The 61.8% Fibonacci retracement of the XA leg (1136)
- The 161.8% Fib extension of the BC leg (1138)
- An AB=CD pattern (1137)
- The 200-day moving average (1132)
With all these resistance levels congregating at the same level, a variety of technical traders could come out of the woodwork to sell gold. In that base, a pullback toward previous resistance-turned-support around 1100-05 or lower could emerge over the coming days.
Of course, any technical pattern merely identifies where there is a higher probability of a turning point or continuation, so there’s no guarantee that a top will automatically emerge off this resistance level. As the trading maxim goes, technical patterns provide points of reflection, not necessarily points of inflection. In other words, if bulls are able to drive gold through the current resistance barrier, it would be a clear show of strength that could take gold toward 1160 or above in the coming days. Readers looking to handicap one way or another may also want to keep an eye on the secondary indicators; if either the MACD or RSI show signs of rolling over and ending their uptrends, the price of gold could quickly follow.
StoneX Financial Ltd (trading as “City Index”) is an execution-only service provider. This material, whether or not it states any opinions, is for general information purposes only and it does not take into account your personal circumstances or objectives. This material has been prepared using the thoughts and opinions of the author and these may change. However, City Index does not plan to provide further updates to any material once published and it is not under any obligation to keep this material up to date. This material is short term in nature and may only relate to facts and circumstances existing at a specific time or day. Nothing in this material is (or should be considered to be) financial, investment, legal, tax or other advice and no reliance should be placed on it.
No opinion given in this material constitutes a recommendation by City Index or the author that any particular investment, security, transaction or investment strategy is suitable for any specific person. The material has not been prepared in accordance with legal requirements designed to promote the independence of investment research. Although City Index is not specifically prevented from dealing before providing this material, City Index does not seek to take advantage of the material prior to its dissemination. This material is not intended for distribution to, or use by, any person in any country or jurisdiction where such distribution or use would be contrary to local law or regulation.
For further details see our full non-independent research disclaimer and quarterly summary.
CFDs are complex instruments and come with a high risk of losing money rapidly due to leverage. 69% of retail investor accounts lose money when trading CFDs with this provider. You should consider whether you understand how CFDs work and whether you can afford to take the high risk of losing your money. CFD and Forex Trading are leveraged products and your capital is at risk. They may not be suitable for everyone. Please ensure you fully understand the risks involved by reading our full risk warning.
City Index is a trading name of StoneX Financial Ltd. Head and Registered Office: 1st Floor, Moor House, 120 London Wall, London, EC2Y 5ET. StoneX Financial Ltd is a company registered in England and Wales, number: 05616586. Authorised and regulated by the Financial Conduct Authority. FCA Register Number: 446717.
City Index is a trademark of StoneX Financial Ltd.
The information on this website is not targeted at the general public of any particular country. It is not intended for distribution to residents in any country where such distribution or use would contravene any local law or regulatory requirement.
© City Index 2024