Gold verging on bullish breakout
This included the formal announcement of Average Inflation Targeting (AIT) as well as the Feds lukewarm enthusiasm for Yield Curve Control (YCC), based on their view that in the current environment the use of YCC would have only limited impact and be costly.
Overnight a speech by Fed Vice Chair Clarida has refocussed the market's attention on the possibility of YCC being used by the Fed in the future.
“Yield caps and targets were not warranted in the current environment but should remain an option that the committee could reassess in the future if circumstances changed markedly.”
Assuming the Fed is determined to boost inflation expectations and to let the economy run hot, real interest rates need to remain pinned deeply in negative yield territory. YCC is an effective way to do this and this realisation has caused gold, one of the chief beneficiaries of negative real rates to spring to life this morning.
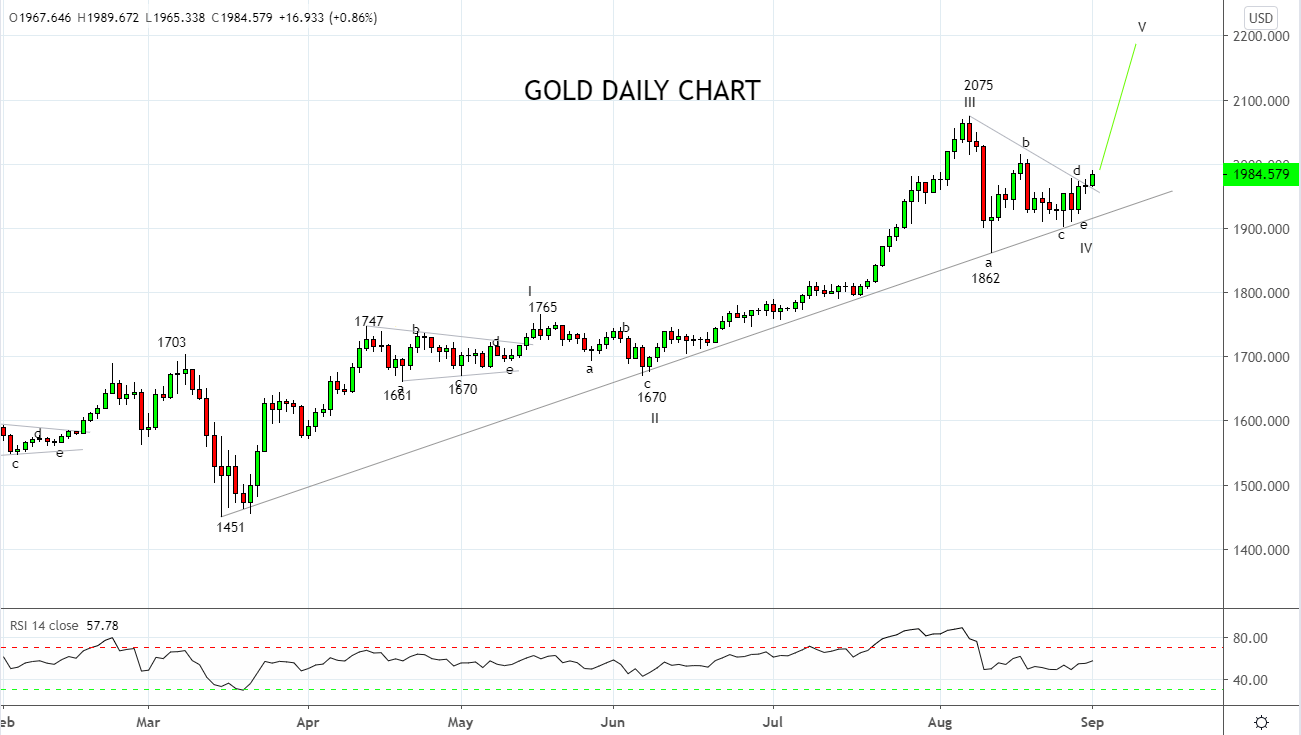
As noted in the Week Ahead video on Monday at around the 6 minute and 30-second mark, should gold break above recent highs $1980 it would be initial confirmation that the correction from the $2075 high is complete at the $1862 low and that the uptrend has resumed.
The key technical reasons to support this:
- The dip to $1862 picked up trendline support from the March $1451 low, keeping golds uptrend intact.
- Over the past three weeks gold appears to have traced out another 5 wave (abcde) triangular corrective pattern. This type of pattern was also evident before strong rallies in January and April this year.
- A break and daily close above the downtrend line from the $2075 high would be further confirmation the uptrend has resumed.
In a nutshell, post the break of resistance this morning and following the Clarida speech overnight, we favour re-opening longs in gold, leaving room to add should gold post a daily close above $1980. The target is a retest and break of the $2075 high. The stop loss should be placed $5 below interim support $1950. Or even better, below the uptrend support currently at $1915.
Source Tradingview. The figures stated areas of the 1st of September 2020. Past performance is not a reliable indicator of future performance. This report does not contain and is not to be taken as containing any financial product advice or financial product recommendation
StoneX Financial Ltd (trading as “City Index”) is an execution-only service provider. This material, whether or not it states any opinions, is for general information purposes only and it does not take into account your personal circumstances or objectives. This material has been prepared using the thoughts and opinions of the author and these may change. However, City Index does not plan to provide further updates to any material once published and it is not under any obligation to keep this material up to date. This material is short term in nature and may only relate to facts and circumstances existing at a specific time or day. Nothing in this material is (or should be considered to be) financial, investment, legal, tax or other advice and no reliance should be placed on it.
No opinion given in this material constitutes a recommendation by City Index or the author that any particular investment, security, transaction or investment strategy is suitable for any specific person. The material has not been prepared in accordance with legal requirements designed to promote the independence of investment research. Although City Index is not specifically prevented from dealing before providing this material, City Index does not seek to take advantage of the material prior to its dissemination. This material is not intended for distribution to, or use by, any person in any country or jurisdiction where such distribution or use would be contrary to local law or regulation.
For further details see our full non-independent research disclaimer and quarterly summary.
CFDs are complex instruments and come with a high risk of losing money rapidly due to leverage. 69% of retail investor accounts lose money when trading CFDs with this provider. You should consider whether you understand how CFDs work and whether you can afford to take the high risk of losing your money. CFD and Forex Trading are leveraged products and your capital is at risk. They may not be suitable for everyone. Please ensure you fully understand the risks involved by reading our full risk warning.
City Index is a trading name of StoneX Financial Ltd. Head and Registered Office: 1st Floor, Moor House, 120 London Wall, London, EC2Y 5ET. StoneX Financial Ltd is a company registered in England and Wales, number: 05616586. Authorised and regulated by the Financial Conduct Authority. FCA Register Number: 446717.
City Index is a trademark of StoneX Financial Ltd.
The information on this website is not targeted at the general public of any particular country. It is not intended for distribution to residents in any country where such distribution or use would contravene any local law or regulatory requirement.
© City Index 2024