Gold technical analysis projections for 2014
What were the key gold price movements during 2013?
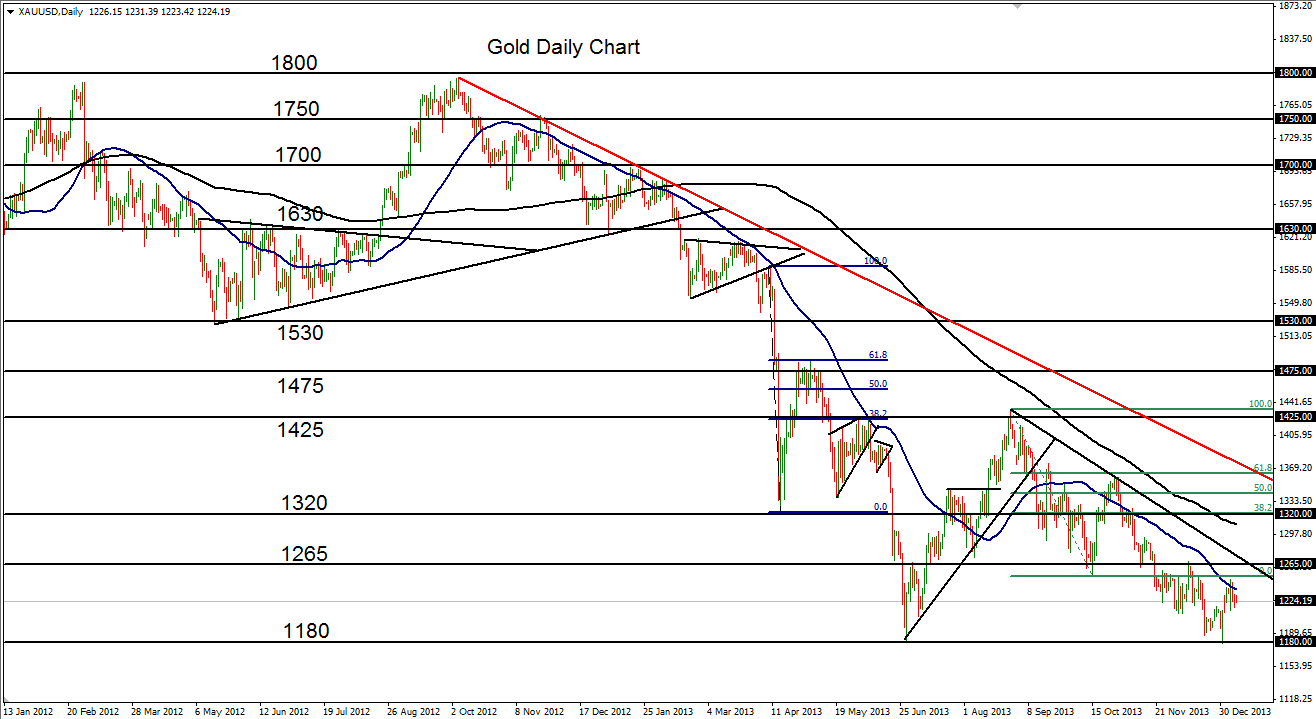
Gold (a daily chart of which is shown) has spent the majority of 2013 in one unmistakable direction – to the downside.
From the beginning of the current downtrend below the 1800 resistance high in October 2012, the precious metal has generally depreciated: sometimes dramatically and at other times interrupted by sharp pullbacks to the upside.
Overall, since that October 2012 high, gold has sustained heavy pressure to the downside.
After dropping to progressively lower lows throughout the first half of 2013, a low extreme at 1180 was established in late June, hitting close to a three-year low for the precious metal. The next two months saw a substantial correction that brought price up to an intermediate peak of 1433 in late August.
From that high, price dropped down to a low of 1251 in mid-October before pulling back up two-weeks later to 1361, which was the 61.8% Fibonacci retracement of the prior bearish leg.
After that upside pullback, gold fell sharply on its way towards its major downside objective – the noted 1180 multi-year low established in late June.
The very end of 2013 saw price re-test that low, establishing more than a three-year low at 1178 on the last day of the year.
Looking forward: the gold forecast for 2014
The beginning of 2014 saw a minor pullback to the upside that has so far failed to overcome the strong bearish pressure.
The current bearish environment is reinforced by the price of gold being slightly below its 50-day moving average which is, in turn, well below its 200-day moving average. Both of these averages are pointing decisively to the downside.
Moving further into 2014, a continued bearish environment should potentially prevail for gold.
Any further breakdown below the 1178 low would confirm a continuation of the sustained bearish trend that has been in place since the noted October 2012 1800-area high.
A breakdown below 1178 could then potentially position gold to target further downside around the 1000 psychological support level.
Upside resistance within the current bearish environment continues to reside around the major 1265 resistance area.
Interested in what the year might bring for the major currency pairs? Check out the other articles in this series:
GBP/USD forecast for 2014
EUR/USD forecast for 2014
USD/JPY forecast for 2014
AUD/USD forecast for 2014
StoneX Financial Ltd (trading as “City Index”) is an execution-only service provider. This material, whether or not it states any opinions, is for general information purposes only and it does not take into account your personal circumstances or objectives. This material has been prepared using the thoughts and opinions of the author and these may change. However, City Index does not plan to provide further updates to any material once published and it is not under any obligation to keep this material up to date. This material is short term in nature and may only relate to facts and circumstances existing at a specific time or day. Nothing in this material is (or should be considered to be) financial, investment, legal, tax or other advice and no reliance should be placed on it.
No opinion given in this material constitutes a recommendation by City Index or the author that any particular investment, security, transaction or investment strategy is suitable for any specific person. The material has not been prepared in accordance with legal requirements designed to promote the independence of investment research. Although City Index is not specifically prevented from dealing before providing this material, City Index does not seek to take advantage of the material prior to its dissemination. This material is not intended for distribution to, or use by, any person in any country or jurisdiction where such distribution or use would be contrary to local law or regulation.
For further details see our full non-independent research disclaimer and quarterly summary.
CFDs are complex instruments and come with a high risk of losing money rapidly due to leverage. 69% of retail investor accounts lose money when trading CFDs with this provider. You should consider whether you understand how CFDs work and whether you can afford to take the high risk of losing your money. CFD and Forex Trading are leveraged products and your capital is at risk. They may not be suitable for everyone. Please ensure you fully understand the risks involved by reading our full risk warning.
City Index is a trading name of StoneX Financial Ltd. Head and Registered Office: 1st Floor, Moor House, 120 London Wall, London, EC2Y 5ET. StoneX Financial Ltd is a company registered in England and Wales, number: 05616586. Authorised and regulated by the Financial Conduct Authority. FCA Register Number: 446717.
City Index is a trademark of StoneX Financial Ltd.
The information on this website is not targeted at the general public of any particular country. It is not intended for distribution to residents in any country where such distribution or use would contravene any local law or regulatory requirement.
© City Index 2024