Gold Stocks Ratio 8217 s Worst Decline in 2 Decades
Either way you look at it, stocks have taken the shine off gold.
Gold is down 6% on the year, compared to +25% for the Nikkei, 10% for the Dow Jones-30, 8% for the S&P500, 6% for Nasdaq and 5% for the FTSE-100 over the same period.
Falling gold may well be blamed on growing signals from Federal Reserve officials considering slowing down the pace of asset purchases from its current $85 bn/month. But the metal selloff is also joining a broad decline in commodities this year. Out of a group of 18 commodities (metals, energy and agriculture), only 5 are up (WTI, gasoline, natural gas, palladium and cotton).
The “China cooling” factor had been an issue, as seen in slowing economic growth, business diffusion indices and the 2-month decline in copper prices. Forced selling by commodities’ funds was also major factor in dragging down gold as fund managers sought to absorb losses in other markets. Hedge funds losing from the 20-30% declines in Apple shares were also among those selling some of their gold holdings to stabilize portfolio losses.
Increased confidence by investors that the ECB would do what it takes to save the Eurozone and its currency is highlighted in persistent declines in the bond yields of peripheral nations (Spanish 10-year yields have hit 2.5 year lows and Italian 10-yr yields are down 12% since the election stand-off of late February). Thus, the threat of an exit by a Eurozone member has markedly diminished. This was clearly seen in gold’s muted reaction to Cyprus announcement to tax bank deposits.
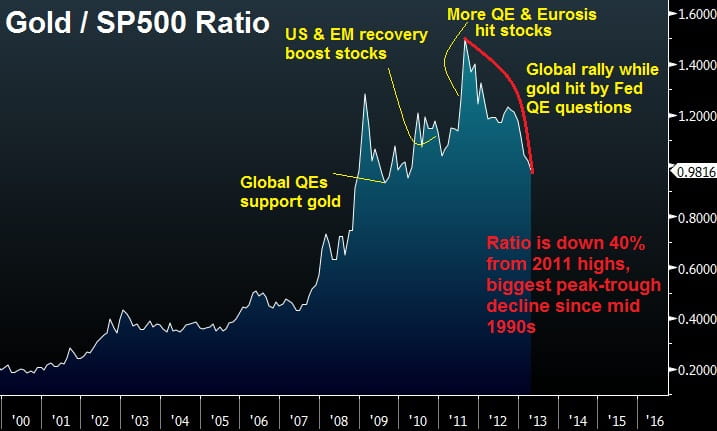
Comparing gold to stocks, the situation is of serious concern to gold bugs. Using the gold/S&P500 ratio, it has fallen below 1.0 for the first time in 3 years. The ratio is down 40% from its 23-year peak of August 2011. This is the longest decline since mid-1990s.
Even as most market participants expect the Fed’s hesitations over QE continuity to not materialize into an actual reduction in asset purchases before year-end, the negative impact of these Fed discussions is weighing more on gold than on equities.
With our expectations for further selling in gold partly emerging on renewed fund selling to stabilize portfolio losses from the next stocks, or escalating rhetoric from hawkish Fed members, the road to $1,500/oz appears set. It would take an S&P500 decline of about 4% to reach the next key support of 1527-28 in order to attempt reversing the Gold/SPX ratio back to 1.0. But that would be insufficient. As symbolic as the Gold/Stocks ratio may appear to some, the 40% decline of the past 6 months is more than just symbolic, and so is the fact that it has fallen for 6 consecutive months, the longest series of declines in 22 years.
StoneX Financial Ltd (trading as “City Index”) is an execution-only service provider. This material, whether or not it states any opinions, is for general information purposes only and it does not take into account your personal circumstances or objectives. This material has been prepared using the thoughts and opinions of the author and these may change. However, City Index does not plan to provide further updates to any material once published and it is not under any obligation to keep this material up to date. This material is short term in nature and may only relate to facts and circumstances existing at a specific time or day. Nothing in this material is (or should be considered to be) financial, investment, legal, tax or other advice and no reliance should be placed on it.
No opinion given in this material constitutes a recommendation by City Index or the author that any particular investment, security, transaction or investment strategy is suitable for any specific person. The material has not been prepared in accordance with legal requirements designed to promote the independence of investment research. Although City Index is not specifically prevented from dealing before providing this material, City Index does not seek to take advantage of the material prior to its dissemination. This material is not intended for distribution to, or use by, any person in any country or jurisdiction where such distribution or use would be contrary to local law or regulation.
For further details see our full non-independent research disclaimer and quarterly summary.
CFDs are complex instruments and come with a high risk of losing money rapidly due to leverage. 69% of retail investor accounts lose money when trading CFDs with this provider. You should consider whether you understand how CFDs work and whether you can afford to take the high risk of losing your money. CFD and Forex Trading are leveraged products and your capital is at risk. They may not be suitable for everyone. Please ensure you fully understand the risks involved by reading our full risk warning.
City Index is a trading name of StoneX Financial Ltd. Head and Registered Office: 1st Floor, Moor House, 120 London Wall, London, EC2Y 5ET. StoneX Financial Ltd is a company registered in England and Wales, number: 05616586. Authorised and regulated by the Financial Conduct Authority. FCA Register Number: 446717.
City Index is a trademark of StoneX Financial Ltd.
The information on this website is not targeted at the general public of any particular country. It is not intended for distribution to residents in any country where such distribution or use would contravene any local law or regulatory requirement.
© City Index 2024