Gold soars as risk appetite plunges
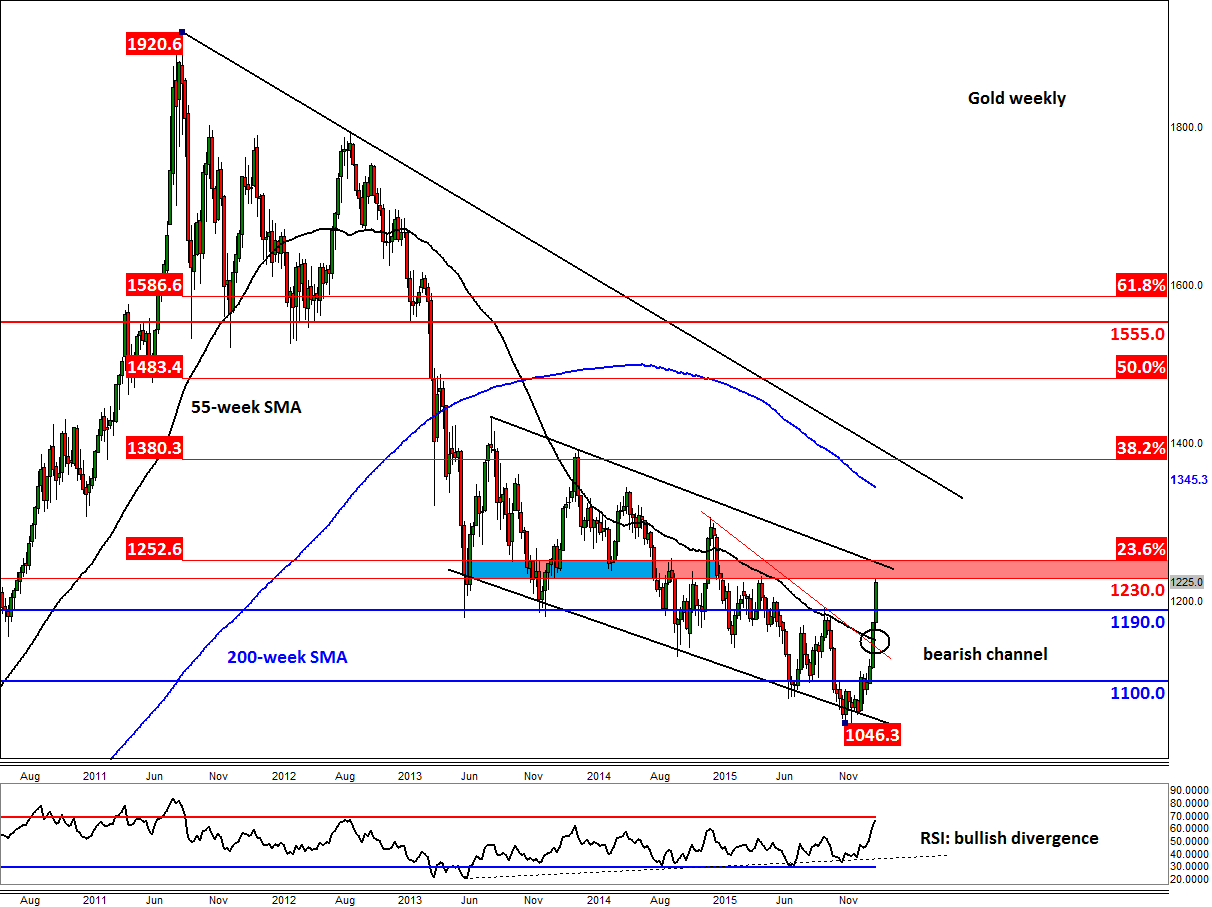
Gold’s sharp rally off December’s low of $1046 has seen its price rise more than 17 per cent in the space of a few weeks. At the time of writing today, the precious metal was trading at just shy of $1230. Gold’s sudden waking from its slumber has caught many people by surprise, myself included. Likewise, the stock market plunge has lasted a lot longer than what most people had probably envisaged when it first started to descend. Clearly, gold’s status as the ultimate safe haven asset has well and truly been confirmed, yet again. The buck-denominated precious metal has also benefitted from a weaker dollar as hopes about further 2016 rate rises from the Federal Reserve have basically been dashed. Janet Yellen, the Fed’s Chairwoman, more or less confirmed that no further rate rises are on the horizon at her testimony yesterday. Consequently, the opportunity cost of holding the yellow metal, which pays no interest, has been reduced on a relative basis. Hence, investors have rushed back into gold, as evidenced, for example, by the continued inflows into gold-backed ETFs. The only thing that could stop gold now is if the dollar and/or stocks rebound strongly; unlikely events. That being said, there will be some US data out on Friday which could potentially provide some support to the dollar, while stocks could rebound on potential intervention from a major central bank or if oil bounces back, with WTI now being below $26.50 a barrel!
On the physical side of the equation, demand for gold in the fourth quarter of last year jumped 4% year-over-year according to the World Gold Council. Investment demand rose 15% while central banks expanded their purchases by a further 25%. Due to weaker demand in the first half of 2015, total gold demand was slightly lower than the previous year, however. Clearly, the lower prices of gold led to a significant rise in demand in the second half of 2015, especially for coins, bars and jewellery. China maintained its position as the largest consumer of gold, followed closely by India. Going forward, the WGC thinks that demand from both nations is set to rise in 2016.
Nearly all of the short-term resistance levels have broken down with so much ease, suggesting that gold could be in the process of a major upward cycle. Looking at the long-term weekly chart, below, there is still some potential resistance that it needs to clear in the range between $1230 and $1250. Here, the upper resistance trend of a bearish channel meets the shallow 23.6% Fibonacci retracement level of the entire 2011-2015 downswing. This channel has been in place since 2013, and given the overbought conditions on smaller time frames, the precious metal may at the very least pause for breath here.
That being said, the break above the 55-week average has been sustained, while the ease at which other short term resistances have broken down is also noteworthy. Added to this, the momentum indicator RSI had already formed a triple divergence with price, correctly suggesting that the selling pressure was waning towards the end of 2015. All of these indications point to a break out of the channel. If seen, gold could potentially rise towards its 200-week average at $1345 or even test the long-term bearish trend and 38.2% Fibonacci level at $1380.
Now that the key resistance at $1190 has broken down, the buyers will be happy for as long as price holds above this level. In the event that it breaks back below this level however, fresh selling pressure could resume. For now, all the focus is on the $1230-50 range, which as mentioned, marks the resistance trend of the bearish channel and 23.6% Fibonacci level.
StoneX Financial Ltd (trading as “City Index”) is an execution-only service provider. This material, whether or not it states any opinions, is for general information purposes only and it does not take into account your personal circumstances or objectives. This material has been prepared using the thoughts and opinions of the author and these may change. However, City Index does not plan to provide further updates to any material once published and it is not under any obligation to keep this material up to date. This material is short term in nature and may only relate to facts and circumstances existing at a specific time or day. Nothing in this material is (or should be considered to be) financial, investment, legal, tax or other advice and no reliance should be placed on it.
No opinion given in this material constitutes a recommendation by City Index or the author that any particular investment, security, transaction or investment strategy is suitable for any specific person. The material has not been prepared in accordance with legal requirements designed to promote the independence of investment research. Although City Index is not specifically prevented from dealing before providing this material, City Index does not seek to take advantage of the material prior to its dissemination. This material is not intended for distribution to, or use by, any person in any country or jurisdiction where such distribution or use would be contrary to local law or regulation.
For further details see our full non-independent research disclaimer and quarterly summary.
CFDs are complex instruments and come with a high risk of losing money rapidly due to leverage. 69% of retail investor accounts lose money when trading CFDs with this provider. You should consider whether you understand how CFDs work and whether you can afford to take the high risk of losing your money. CFD and Forex Trading are leveraged products and your capital is at risk. They may not be suitable for everyone. Please ensure you fully understand the risks involved by reading our full risk warning.
City Index is a trading name of StoneX Financial Ltd. Head and Registered Office: 1st Floor, Moor House, 120 London Wall, London, EC2Y 5ET. StoneX Financial Ltd is a company registered in England and Wales, number: 05616586. Authorised and regulated by the Financial Conduct Authority. FCA Register Number: 446717.
City Index is a trademark of StoneX Financial Ltd.
The information on this website is not targeted at the general public of any particular country. It is not intended for distribution to residents in any country where such distribution or use would contravene any local law or regulatory requirement.
© City Index 2024