Gold s next move could be huge but which direction
Gold ended last week only marginally lower thanks to Friday’s noticeable bounce which saw the precious metal momentarily surpass the $1100 handle. Friday’s counter-trend move was partly in response to news that the second quarter US Employment Cost Index (ECI) showed a very small rise of 0.2% in wage pressure. Traders responded to the data by booking some profit on their long dollar and short gold positions as the month drew to a close. Nevertheless, the yellow metal still ended the month of July with a huge 6.5% loss, which represented its biggest monthly decline since June 2013 when it had dropped by a whopping 12 per cent.
As the new week begins, the precious metal is finding itself back in the more familiar territory of around $1090. Despite the weaker ECI report on Friday and today’s overall weaker-than-expected US macro numbers, gold traders remain wary of a potential rate hike in as early as September or December. They argue that the strong recovery in the US labour market, if sustained, may ultimately put upward pressure on wages and in turn on prices in the coming months. In anticipation of this possibility, the Fed may start tightening monetary policy sooner rather than later so as to reduce the risks of overcooking inflation. But at the moment, inflation is running at extremely low levels across the globe which is another reason why gold is not doing that well. Indeed, the metal is coming under pressure from all angles. Not only has the physical demand from China been weak but optimism among money managers in the paper market is also falling. This is evidenced, for example, by another 8 per cent increase in net short positions in the week to 28 July, according to the CFTC.
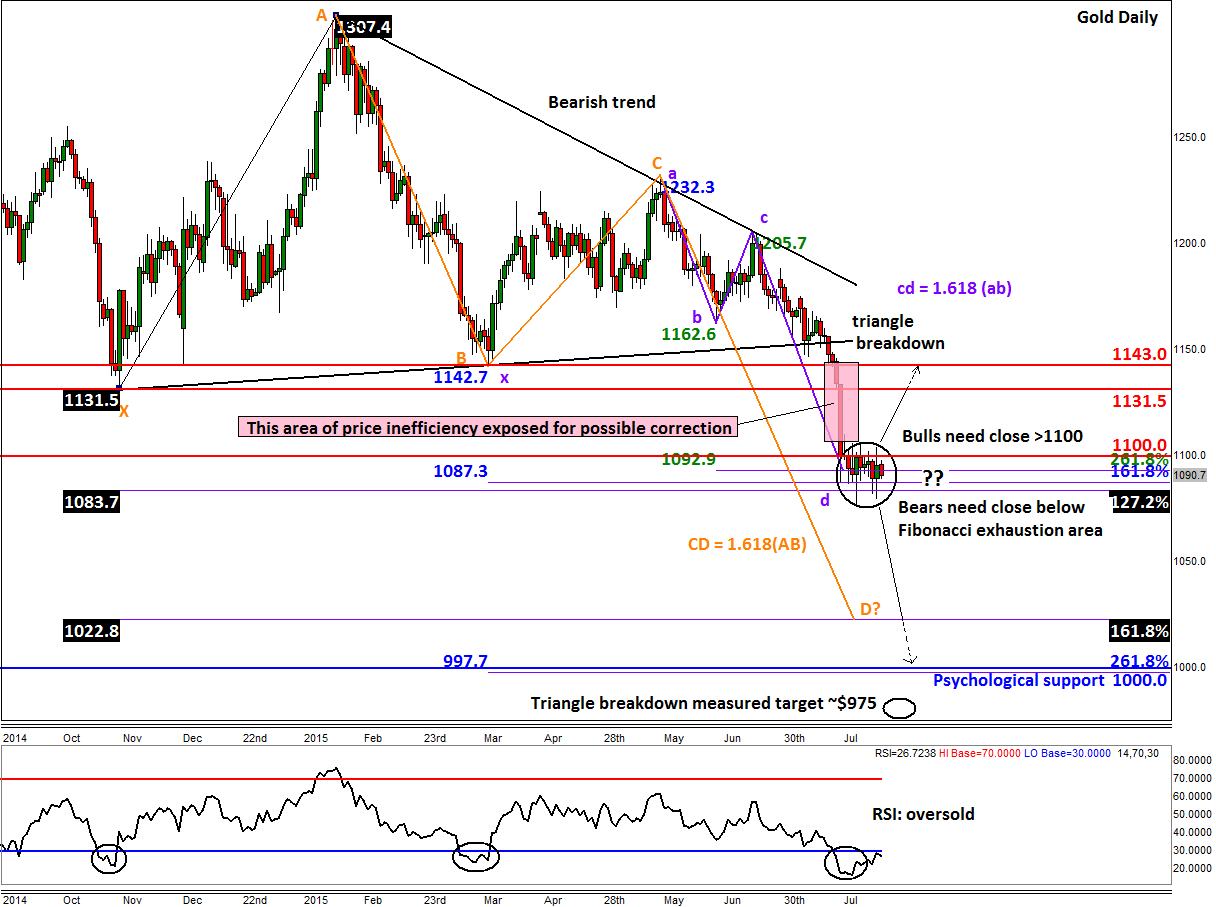
With short gold positions being at a fresh record high, the correction potential is also very high now. For gold to stage a noticeable rally, it will first have to climb above the resistance level of $1100 and hold there on a closing basis. This could happen given that the metal has already reached a Fibonacci extension area between $1083 and $1093. As the RSI is also at an oversold level of below 30, this area thus marks a potential exhaustion point for gold. If gold does correct from here, it may go on to ‘fill’ the area of inefficiency that was created as a result of the sell-off last month (highlighted in red). Consequently, gold could rally towards the old broken supports at $1131.5 or $1143.0, levels that could then turn into resistance.
That being said, sentiment is very bearish on gold and it wouldn’t take much to push the price of the yellow metal below the aforementioned Fibonacci exhaustion area on a daily closing basis. If seen, this may give rise to further follow-up technical selling which could see the metal drop viciously towards the next Fibonacci extension level at $1023 (161.8% extension of the XA swing) where it will also meet the extended point D of an AB=CD pattern. Thereafter is the psychologically-important level of $1000 and then the triangle breakdown measured target around $975.00.
So, gold’s next move could be a sharp one once it breaks out of the recent consolidative range. We could see this breakout at some point this week’s as more US labour market indicators are released prior to Friday’s official jobs report, causing the dollar and in turn gold to move sharply.
StoneX Financial Ltd (trading as “City Index”) is an execution-only service provider. This material, whether or not it states any opinions, is for general information purposes only and it does not take into account your personal circumstances or objectives. This material has been prepared using the thoughts and opinions of the author and these may change. However, City Index does not plan to provide further updates to any material once published and it is not under any obligation to keep this material up to date. This material is short term in nature and may only relate to facts and circumstances existing at a specific time or day. Nothing in this material is (or should be considered to be) financial, investment, legal, tax or other advice and no reliance should be placed on it.
No opinion given in this material constitutes a recommendation by City Index or the author that any particular investment, security, transaction or investment strategy is suitable for any specific person. The material has not been prepared in accordance with legal requirements designed to promote the independence of investment research. Although City Index is not specifically prevented from dealing before providing this material, City Index does not seek to take advantage of the material prior to its dissemination. This material is not intended for distribution to, or use by, any person in any country or jurisdiction where such distribution or use would be contrary to local law or regulation.
For further details see our full non-independent research disclaimer and quarterly summary.
CFDs are complex instruments and come with a high risk of losing money rapidly due to leverage. 69% of retail investor accounts lose money when trading CFDs with this provider. You should consider whether you understand how CFDs work and whether you can afford to take the high risk of losing your money. CFD and Forex Trading are leveraged products and your capital is at risk. They may not be suitable for everyone. Please ensure you fully understand the risks involved by reading our full risk warning.
City Index is a trading name of StoneX Financial Ltd. Head and Registered Office: 1st Floor, Moor House, 120 London Wall, London, EC2Y 5ET. StoneX Financial Ltd is a company registered in England and Wales, number: 05616586. Authorised and regulated by the Financial Conduct Authority. FCA Register Number: 446717.
City Index is a trademark of StoneX Financial Ltd.
The information on this website is not targeted at the general public of any particular country. It is not intended for distribution to residents in any country where such distribution or use would contravene any local law or regulatory requirement.
© City Index 2024