Gold s failure to shine on Black Monday is worrying
During the recent stock market turmoil gold managed to rally sharply as investors sought safe haven assets. Appetite for riskier assets fell in part because of renewed concerns about the health of China, the world’s second largest economy. Concerns were raised following the release of some weaker macroeconomic numbers, including the most recent manufacturing PMI, and the decision by the People’s Bank of China to sharply devalue its currency. The PBOC was at it again today as it further loosened its monetary policy in its latest attempt to shore up confidence and support growth. It cut the benchmark 1-year lending and saving rates by 25 basis points each to 4.6 and 1.75 per cent respectively. In addition, the Reserve Required Ratio (RRR) was dropped by a further 50 basis points. But following an initial positive reactions, stocks soon retreated from their highs. This market behaviour, if sustained, would suggest that either the PBOC’s easing measures were already priced in or simply not bold enough. As stocks retreated a little from their best levels, this helped to lift gold from its earlier lows. But given the fact that the metal was unable to benefit from Monday’s stock market crash, we are sceptical about the precious metal’s ability to sustain its recent gains. If Monday’s events were not enough of a reason for the gold bulls to come out en masse then what would it take? Also, the US dollar apparently failed to find much safe haven demand on Monday with the EUR/USD surging higher and USD/JPY tumbling, though it did well against emerging market and commodity currencies. Thus both stocks and the dollar fell. Normally, this combination would have boosted the price of gold, but it didn’t on Monday. This could be a sign of things to come for the remainder of this week, especially if the stock markets stabilise.
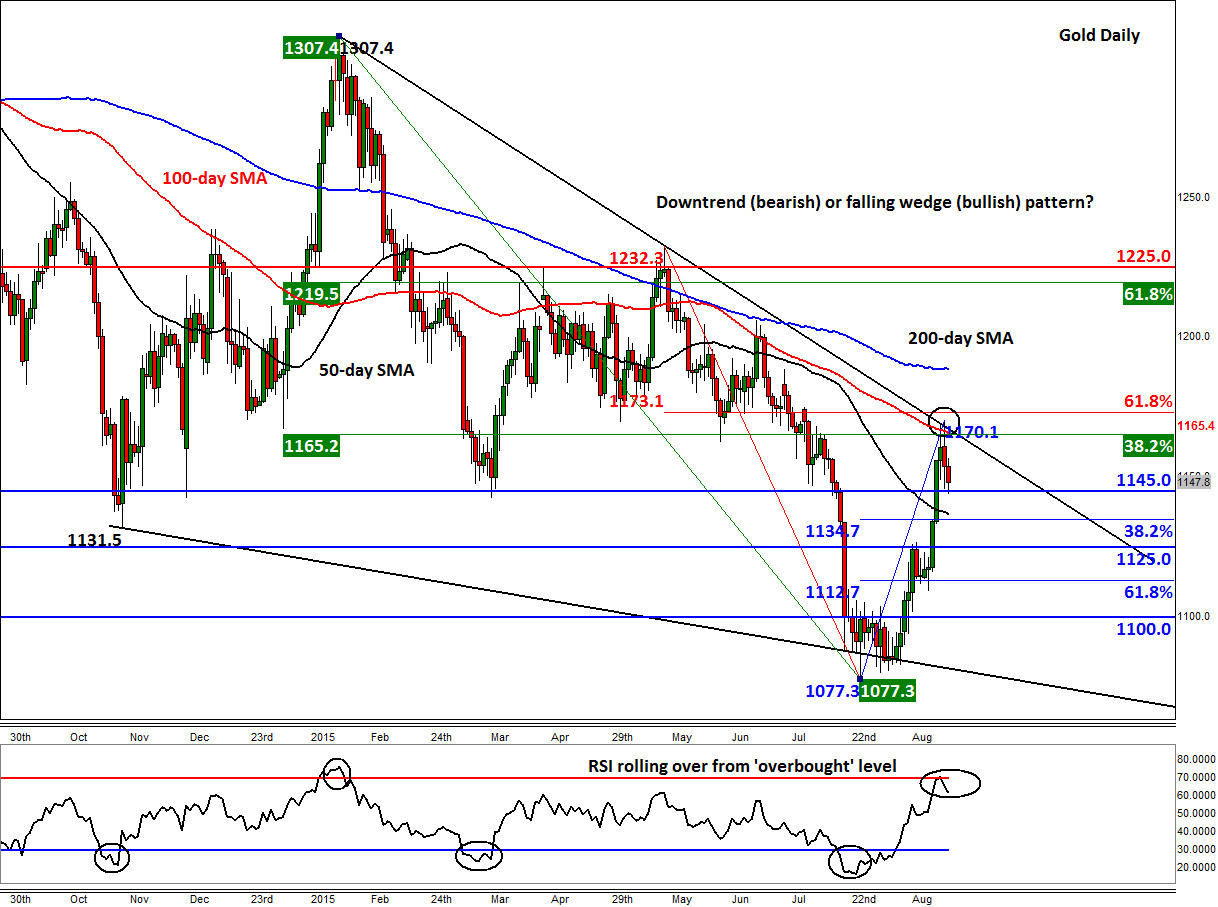
But from a technical point of view, gold’s decline over the past couple of days make some sense. As can be seen from the chart, the precious metal has come under pressure because of the concentration of several technical factors around the $1165/70 area. Here, the 100-day moving average meets a medium-term bearish trend line and the 38.2% Fibonacci retracement of the downswing from the 2015 high that was achieved in January at $1307. Thus it is likely that the bulls took some profit here and some bears re-entered at better levels.
At the time of this writing, gold is testing support $1145, a level which had been support and resistance in the past. If the bears manage to push gold below this level on a closing basis then we could see further losses in the days to come. Otherwise, a rally back towards, and potentially beyond, the $1165/70 area could be on the cards. The next potential level of support is around $1135/6; this is where the 38.2% Fibonacci retracement of the recent up move meets the 50-day moving average. Further supports could be around $1125 or the 61.8% Fibonacci level at $1112/3. On the upside, a break above the aforementioned $1165/70 resistance area would technically be very bullish. That’s because it would also confirm the break out from a potential falling wedge bullish pattern. That being said, gold does tend to respond very well to the 61.8% Fibonacci level, which hasn’t been tested yet for the shorter-term downswing that began in May, at $1173. Thus a decisive break above the $1173 level is needed in order for the metal go for the 200-day moving average at $1188 or the 61.8% retracement level of the larger swing around $1220, before deciding on its next move.
StoneX Financial Ltd (trading as “City Index”) is an execution-only service provider. This material, whether or not it states any opinions, is for general information purposes only and it does not take into account your personal circumstances or objectives. This material has been prepared using the thoughts and opinions of the author and these may change. However, City Index does not plan to provide further updates to any material once published and it is not under any obligation to keep this material up to date. This material is short term in nature and may only relate to facts and circumstances existing at a specific time or day. Nothing in this material is (or should be considered to be) financial, investment, legal, tax or other advice and no reliance should be placed on it.
No opinion given in this material constitutes a recommendation by City Index or the author that any particular investment, security, transaction or investment strategy is suitable for any specific person. The material has not been prepared in accordance with legal requirements designed to promote the independence of investment research. Although City Index is not specifically prevented from dealing before providing this material, City Index does not seek to take advantage of the material prior to its dissemination. This material is not intended for distribution to, or use by, any person in any country or jurisdiction where such distribution or use would be contrary to local law or regulation.
For further details see our full non-independent research disclaimer and quarterly summary.
CFDs are complex instruments and come with a high risk of losing money rapidly due to leverage. 69% of retail investor accounts lose money when trading CFDs with this provider. You should consider whether you understand how CFDs work and whether you can afford to take the high risk of losing your money. CFD and Forex Trading are leveraged products and your capital is at risk. They may not be suitable for everyone. Please ensure you fully understand the risks involved by reading our full risk warning.
City Index is a trading name of StoneX Financial Ltd. Head and Registered Office: 1st Floor, Moor House, 120 London Wall, London, EC2Y 5ET. StoneX Financial Ltd is a company registered in England and Wales, number: 05616586. Authorised and regulated by the Financial Conduct Authority. FCA Register Number: 446717.
City Index is a trademark of StoneX Financial Ltd.
The information on this website is not targeted at the general public of any particular country. It is not intended for distribution to residents in any country where such distribution or use would contravene any local law or regulatory requirement.
© City Index 2024