Gold may no longer be Head and Shoulders above the rest
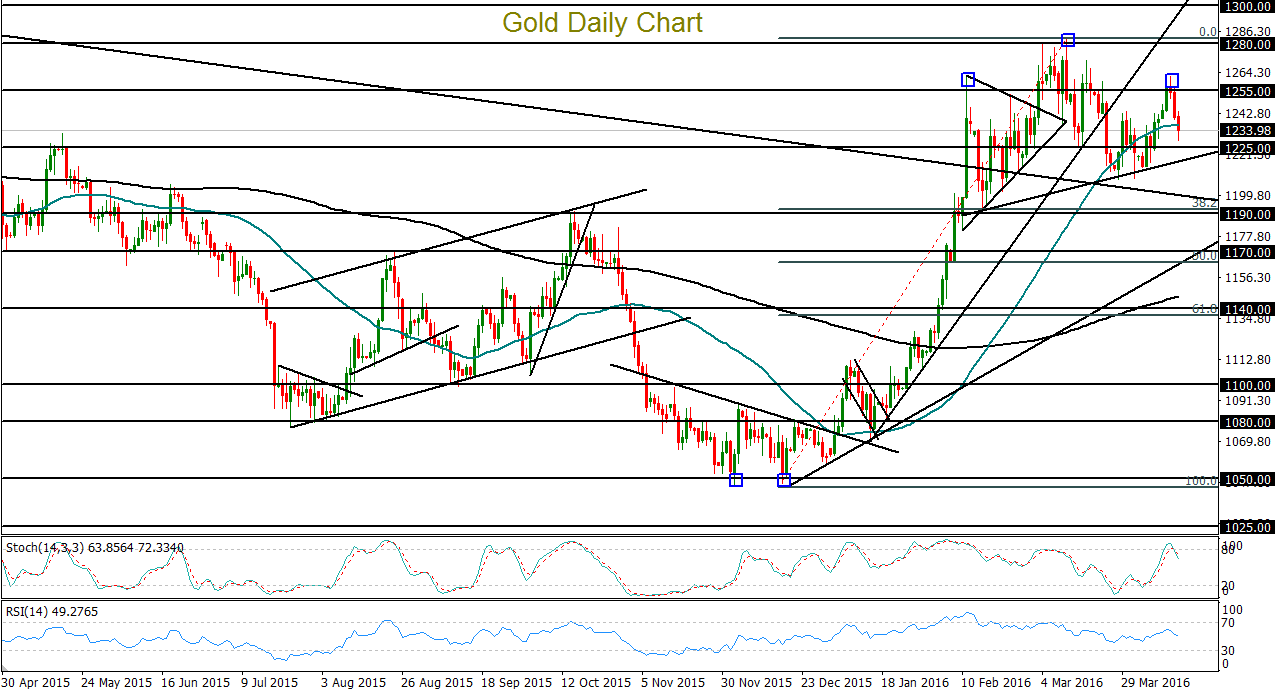
The dramatic rise of gold in the first quarter of this year has coincided with a general decline of the US dollar as well as pronounced turmoil in financial markets, particularly towards the earlier part of the year. With the dollar-denominated precious metal benefiting from both a weakening of the greenback as well safe haven flows when volatility recently shook the equity markets, gold reached more than a one-year high above $1280 just a month ago in mid-March.
Within the past two months, however, equities have rebounded strongly and the dollar, though still pressured by a cautious and seemingly dovish Federal Reserve, continues to vacillate on every unexpected word uttered by Fed members. This environment has helped to slow gold’s rise to the point where its momentum has been almost entirely stalled and it has formed what appears to be a potential topping pattern.
This technical pattern is a rather clear head-and-shoulders formation with its head at the noted one-year high above $1280, and its right shoulder having just formed earlier this week at around the same price level (approximately $1263) as its left shoulder that was formed in February. Generally considered a potential reversal pattern, a head-and-shoulders chart formation represents a market’s multiple failed attempts to rise followed by possible capitulation. The setup is typically confirmed on a breakdown below the “neckline” of the pattern, which in the case of gold is currently around the $1217 level, not far below the current price.
Any near-term resumption of stock market volatility and/or further pronounced weakening of the US dollar in the event that the Fed becomes even more staunchly dovish could invalidate this potential reversal pattern for gold. In the absence of these gold-supporting events, however, a breakdown below the head-and-shoulders neckline could prompt a significant fall for the precious metal, with initial downside targets at the key $1190 and then $1170 support levels. The pattern’s actual measured target would be around the $1140 level, another major support level for gold.
StoneX Financial Ltd (trading as “City Index”) is an execution-only service provider. This material, whether or not it states any opinions, is for general information purposes only and it does not take into account your personal circumstances or objectives. This material has been prepared using the thoughts and opinions of the author and these may change. However, City Index does not plan to provide further updates to any material once published and it is not under any obligation to keep this material up to date. This material is short term in nature and may only relate to facts and circumstances existing at a specific time or day. Nothing in this material is (or should be considered to be) financial, investment, legal, tax or other advice and no reliance should be placed on it.
No opinion given in this material constitutes a recommendation by City Index or the author that any particular investment, security, transaction or investment strategy is suitable for any specific person. The material has not been prepared in accordance with legal requirements designed to promote the independence of investment research. Although City Index is not specifically prevented from dealing before providing this material, City Index does not seek to take advantage of the material prior to its dissemination. This material is not intended for distribution to, or use by, any person in any country or jurisdiction where such distribution or use would be contrary to local law or regulation.
For further details see our full non-independent research disclaimer and quarterly summary.
CFDs are complex instruments and come with a high risk of losing money rapidly due to leverage. 69% of retail investor accounts lose money when trading CFDs with this provider. You should consider whether you understand how CFDs work and whether you can afford to take the high risk of losing your money. CFD and Forex Trading are leveraged products and your capital is at risk. They may not be suitable for everyone. Please ensure you fully understand the risks involved by reading our full risk warning.
City Index is a trading name of StoneX Financial Ltd. Head and Registered Office: 1st Floor, Moor House, 120 London Wall, London, EC2Y 5ET. StoneX Financial Ltd is a company registered in England and Wales, number: 05616586. Authorised and regulated by the Financial Conduct Authority. FCA Register Number: 446717.
City Index is a trademark of StoneX Financial Ltd.
The information on this website is not targeted at the general public of any particular country. It is not intended for distribution to residents in any country where such distribution or use would contravene any local law or regulatory requirement.
© City Index 2024