Gold It s Groundhog Day All Over Again for Frustrated Bulls
Last week, we analyzed the (lack of) safe haven demand for gold in the wake of Greece’s deteriorating debt negotiations, noting that “the yellow metal …[was] dramatically lagging its safe-haven rivals” and that “this week’s lackluster reaction suggests that gold may be losing its luster and on the verge of a big breakdown.” Gold subsequently dropped to a new nearly 4-month low at 1156 on Thursday before recovering slightly into the weekend.
As we open another week of trade, it feels a bit like the 1993 movie “Groundhog Day,” where Bill Murray inexplicably get caught in a time loop and is forced to relive the same day over and over again. Much like in that iconic movie, this week’s moves in gold closely mirror last week’s: the yellow metal gapped slightly higher to start this week after an ostensibly negative development in Greece’s debt negotiations. However, the small bullish gap has already been filled and gold is once again trading below Friday’s open. Gold’s failure to retain any sort of safe-haven bid despite increasing global economic uncertainty represents a strong bearish signal moving forward.
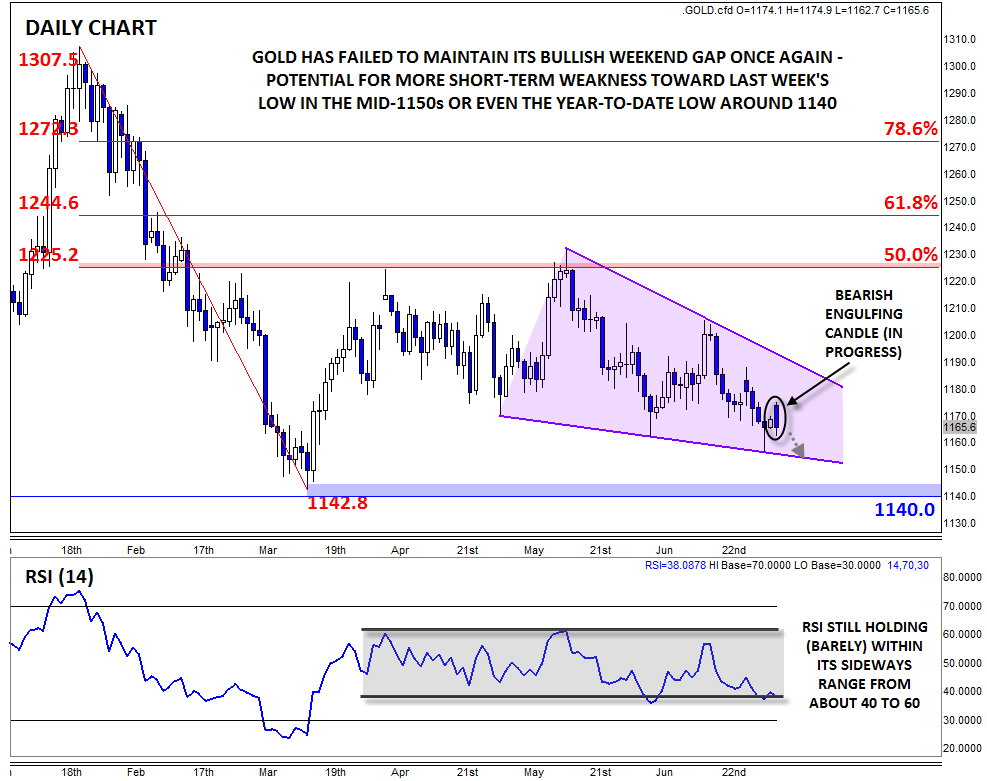
From a technical perspective, gold is working on a potential Bearish Engulfing Candle* on the daily chart, signaling a big shift to selling pressure. Unless we see a rally during today’s US session, this candlestick pattern will suggest a possible continuation down toward last week’s low in the mid-1150s.
The medium-term picture is a bit more constructive, with gold’s RSI indicator still holding within its sideways range and the price of the metal itself forming a falling wedge pattern; despite its ominous-sounding name, this pattern could actually lead to a rally if gold is able to overcome the upper trend line near 1190. For now though, the near-term bias in gold remains lower, with strong support sitting at the year-to-date lows near 1140.
*A Bearish Engulfing candle is formed when the candle breaks above the high of the previous time period before sellers step in and push rates down to close below the low of the previous time period. It indicates that the sellers have wrested control of the market from the buyers.
StoneX Financial Ltd (trading as “City Index”) is an execution-only service provider. This material, whether or not it states any opinions, is for general information purposes only and it does not take into account your personal circumstances or objectives. This material has been prepared using the thoughts and opinions of the author and these may change. However, City Index does not plan to provide further updates to any material once published and it is not under any obligation to keep this material up to date. This material is short term in nature and may only relate to facts and circumstances existing at a specific time or day. Nothing in this material is (or should be considered to be) financial, investment, legal, tax or other advice and no reliance should be placed on it.
No opinion given in this material constitutes a recommendation by City Index or the author that any particular investment, security, transaction or investment strategy is suitable for any specific person. The material has not been prepared in accordance with legal requirements designed to promote the independence of investment research. Although City Index is not specifically prevented from dealing before providing this material, City Index does not seek to take advantage of the material prior to its dissemination. This material is not intended for distribution to, or use by, any person in any country or jurisdiction where such distribution or use would be contrary to local law or regulation.
For further details see our full non-independent research disclaimer and quarterly summary.
CFDs are complex instruments and come with a high risk of losing money rapidly due to leverage. 69% of retail investor accounts lose money when trading CFDs with this provider. You should consider whether you understand how CFDs work and whether you can afford to take the high risk of losing your money. CFD and Forex Trading are leveraged products and your capital is at risk. They may not be suitable for everyone. Please ensure you fully understand the risks involved by reading our full risk warning.
City Index is a trading name of StoneX Financial Ltd. Head and Registered Office: 1st Floor, Moor House, 120 London Wall, London, EC2Y 5ET. StoneX Financial Ltd is a company registered in England and Wales, number: 05616586. Authorised and regulated by the Financial Conduct Authority. FCA Register Number: 446717.
City Index is a trademark of StoneX Financial Ltd.
The information on this website is not targeted at the general public of any particular country. It is not intended for distribution to residents in any country where such distribution or use would contravene any local law or regulatory requirement.
© City Index 2024