Gold finally round ing into form
Everyone’s favorite precious metal has fallen a long way from the halcyon days of a few years ago, when it seemed like gold could do no wrong. Nowadays, traders are more likely to get laughed at then applauded for buying gold, and based on the trend over the last few years, skepticism toward long gold positions is certainly warranted.
As is often the case with markets though, the sentiment may finally have swung too far in the other direction, at least on a short-term basis. Gold has been a big beneficiary of the market turmoil so far this year, as scared traders rushed to the traditional safe haven metal and central banks (prominently including the Fed, RBNZ, and BOJ just this week alone) shift to more dovish, loose money postures.
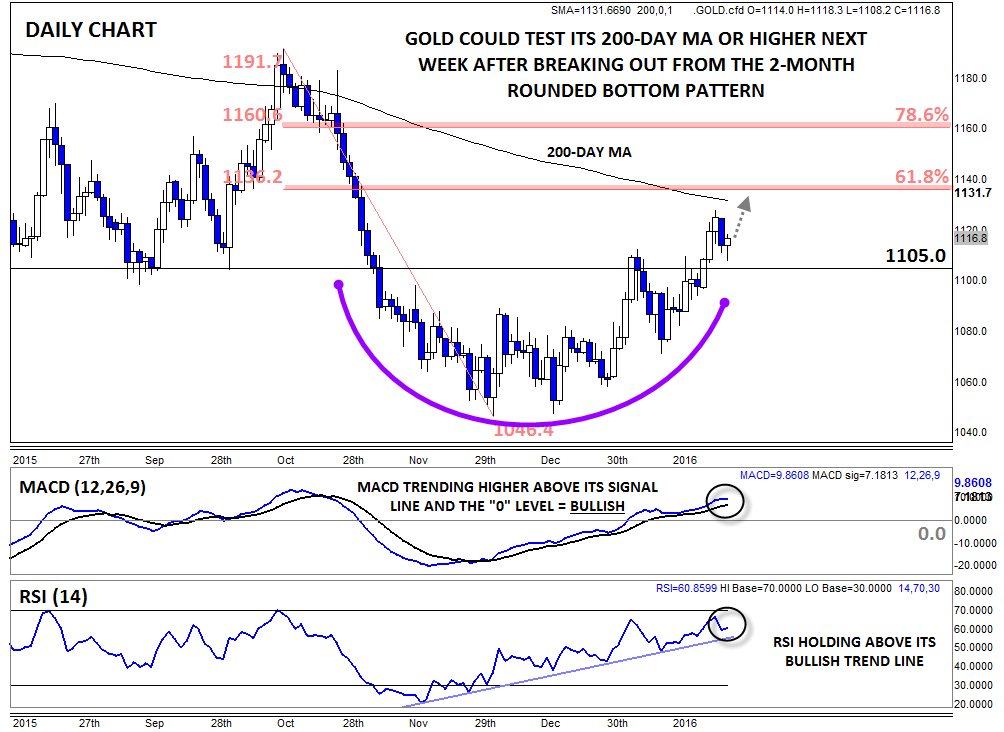
Over the last two months, gold has actually carved out a clear rounded bottom pattern in the mid-1000s. According to our friends at Investopedia.com, Rounded bottoms “are found at the end of extended downward trends and signify a reversal in long-term price movements. This pattern’s time frame can vary from several weeks to several months and is deemed by many traders as a rare occurrence.” While we still feel that it’s premature to call a long-term reversal in gold, the pattern certainly suggests that we could see more strength in gold over the next few weeks.
The secondary indicators bolster the case for further gains in gold. The MACD indicator turned higher back in November and is still trending comfortably upward above both its signal line and the “0” level. Meanwhile, the RSI indicator is following its own bullish trend line higher; both of these developments show strong and growing bullish momentum.
Moving forward, the short-term bias in gold points higher as long as the yellow metal remains above the key 1100-1110 zone. To the topside, the key levels to watch in the coming week will be the 200-day MA at 1130, followed by the 61.8% and 78.6% Fibonacci retracements of the Oct-Nov drop at 1135 and 1160, respectively.
StoneX Financial Ltd (trading as “City Index”) is an execution-only service provider. This material, whether or not it states any opinions, is for general information purposes only and it does not take into account your personal circumstances or objectives. This material has been prepared using the thoughts and opinions of the author and these may change. However, City Index does not plan to provide further updates to any material once published and it is not under any obligation to keep this material up to date. This material is short term in nature and may only relate to facts and circumstances existing at a specific time or day. Nothing in this material is (or should be considered to be) financial, investment, legal, tax or other advice and no reliance should be placed on it.
No opinion given in this material constitutes a recommendation by City Index or the author that any particular investment, security, transaction or investment strategy is suitable for any specific person. The material has not been prepared in accordance with legal requirements designed to promote the independence of investment research. Although City Index is not specifically prevented from dealing before providing this material, City Index does not seek to take advantage of the material prior to its dissemination. This material is not intended for distribution to, or use by, any person in any country or jurisdiction where such distribution or use would be contrary to local law or regulation.
For further details see our full non-independent research disclaimer and quarterly summary.
CFDs are complex instruments and come with a high risk of losing money rapidly due to leverage. 69% of retail investor accounts lose money when trading CFDs with this provider. You should consider whether you understand how CFDs work and whether you can afford to take the high risk of losing your money. CFD and Forex Trading are leveraged products and your capital is at risk. They may not be suitable for everyone. Please ensure you fully understand the risks involved by reading our full risk warning.
City Index is a trading name of StoneX Financial Ltd. Head and Registered Office: 1st Floor, Moor House, 120 London Wall, London, EC2Y 5ET. StoneX Financial Ltd is a company registered in England and Wales, number: 05616586. Authorised and regulated by the Financial Conduct Authority. FCA Register Number: 446717.
City Index is a trademark of StoneX Financial Ltd.
The information on this website is not targeted at the general public of any particular country. It is not intended for distribution to residents in any country where such distribution or use would contravene any local law or regulatory requirement.
© City Index 2024