Gold falls out favour as equities surge
Safe haven gold has been falling out of favour since the start of this week. Investors have apparently been piling into equities, especially in the US where the S&P 500 climbed to a new all-time high on Monday and the index future points to a new record high open this afternoon. Added to this, the dollar has managed to hold onto most of the gains made post Brexit due to a slight improvement in economic data in the US, and speculation over a BOJ easing which has lifted the USD/JPY to a high so far of 104.00 today. But ETF investors continue to pile in on gold, possibly due to the lingering worries about the economic consequences of Brexit and the health of Italian banks. This week’s price slide may therefore be based on profit taking from speculative financial investors.
Indeed, according to positioning data from the CFTC, money managers and other financial speculators had further expanded their net long positions to a new record high in the week to 5 July. In the prior five weeks alone, bullish bets have risen by nearly 85 per cent. Clearly this means that the potential for profit-taking is very high now – and not just for gold. Silver’s net long positions likewise reached a new record high level last week of nearly 81 thousand contracts. Added to this, gold has reached a significant area of technical resistance, as discussed below.
Technical outlook
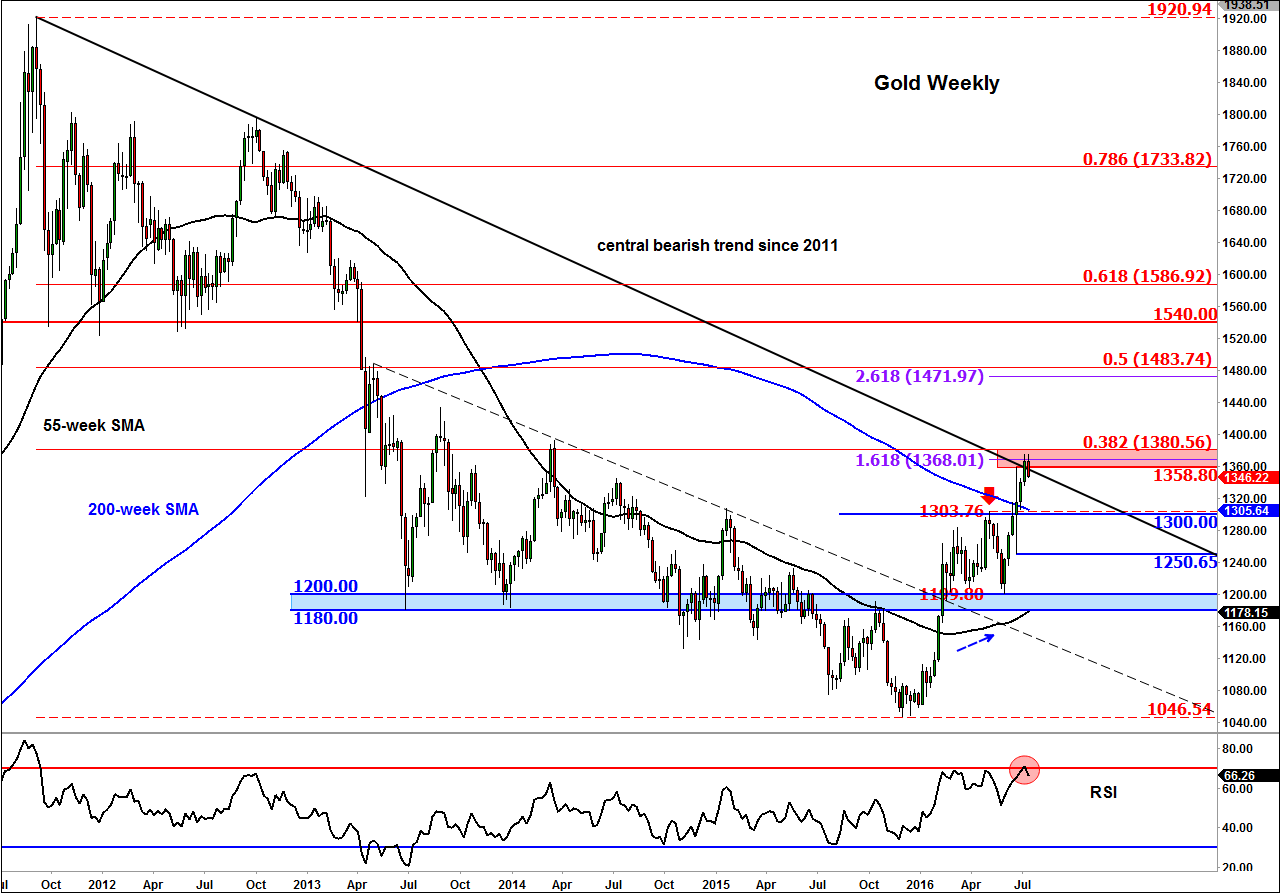
After climbing for five consecutive weeks, gold has now reached a potentially strong resistance area around $1358-$1380. As can be seen from the weekly chart, below, this is where the central bearish trend line that has been place since the year 2011 meets a couple of Fibonacci levels: the 38.2% retracement against that 2011 all-time high and the 161.8% extension of the most recent downswing. Unsurprisingly, the momentum indicator RSI has reached the “overbought” threshold of 70 on the weekly and daily time frames. The RSI probably needs time to unwind now, but it essentially shows strength.
Given the above technical considerations, a pullback of some sort would not come as a surprise to me whatsoever. In fact, this could be a healthy outcome as far as the bullish argument is concerned as it will allow the oscillators to unwind from overbought levels, providing opportunity for new buyers to step in at better levels. If gold consolidates near these highs and the RSI unwinds through time rather than price action then this would point to further sharp gains at some point down the line. The potential levels of support that will need to hold are shown on the chart in blue, the most important one in my view being $1300 (the meeting point of old support with the 200-week moving average).
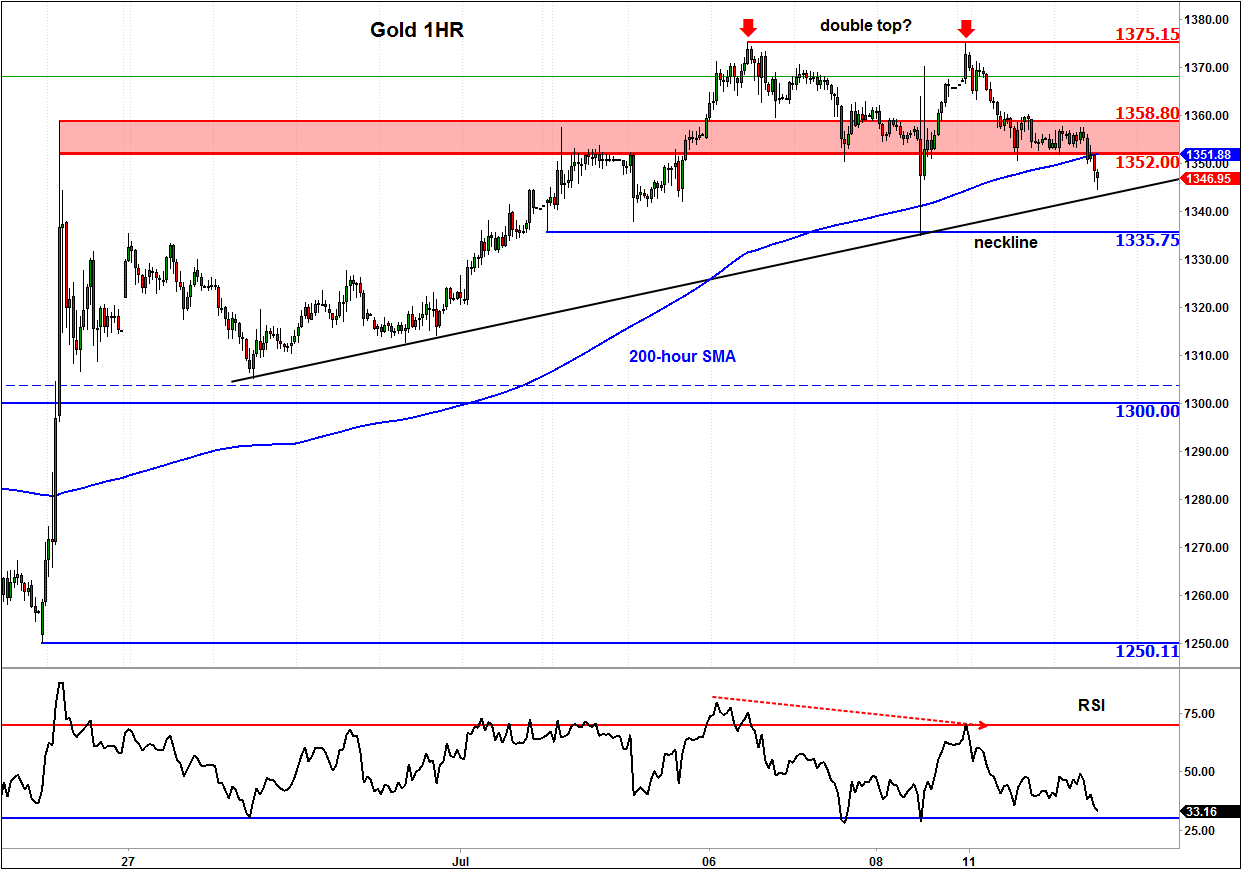
Meanwhile on the much shorter 1 hour chart, gold may have formed a double top formation at $1375. The precious metal has already broken short-term support at the $1352/58 area and has moved below the 200-hour moving average for the first time since June 21. The neckline of the H&S pattern comes into play at $1335/6 area. A decisive break below here could see gold drop all the way to key support at $1300 next. Bullish traders meanwhile may step back in if there is a false breakdown scenario here or if we see the formation of some other bullish patterns. In any case, they will need to be patient now as price could ease further in the short term outlook.
StoneX Financial Ltd (trading as “City Index”) is an execution-only service provider. This material, whether or not it states any opinions, is for general information purposes only and it does not take into account your personal circumstances or objectives. This material has been prepared using the thoughts and opinions of the author and these may change. However, City Index does not plan to provide further updates to any material once published and it is not under any obligation to keep this material up to date. This material is short term in nature and may only relate to facts and circumstances existing at a specific time or day. Nothing in this material is (or should be considered to be) financial, investment, legal, tax or other advice and no reliance should be placed on it.
No opinion given in this material constitutes a recommendation by City Index or the author that any particular investment, security, transaction or investment strategy is suitable for any specific person. The material has not been prepared in accordance with legal requirements designed to promote the independence of investment research. Although City Index is not specifically prevented from dealing before providing this material, City Index does not seek to take advantage of the material prior to its dissemination. This material is not intended for distribution to, or use by, any person in any country or jurisdiction where such distribution or use would be contrary to local law or regulation.
For further details see our full non-independent research disclaimer and quarterly summary.
CFDs are complex instruments and come with a high risk of losing money rapidly due to leverage. 69% of retail investor accounts lose money when trading CFDs with this provider. You should consider whether you understand how CFDs work and whether you can afford to take the high risk of losing your money. CFD and Forex Trading are leveraged products and your capital is at risk. They may not be suitable for everyone. Please ensure you fully understand the risks involved by reading our full risk warning.
City Index is a trading name of StoneX Financial Ltd. Head and Registered Office: 1st Floor, Moor House, 120 London Wall, London, EC2Y 5ET. StoneX Financial Ltd is a company registered in England and Wales, number: 05616586. Authorised and regulated by the Financial Conduct Authority. FCA Register Number: 446717.
City Index is a trademark of StoneX Financial Ltd.
The information on this website is not targeted at the general public of any particular country. It is not intended for distribution to residents in any country where such distribution or use would contravene any local law or regulatory requirement.
© City Index 2024