Gold erodes bearish trend
Gold sharply extended its gains for a second day on Thursday and more than made up the losses suffered earlier in the week. Though the metal is slightly lower at the time of this writing, it is still holding in the positive territory for the week and thus remains on course – US data permitting – to post its second two-week rally since the second week of August. The metal’s upsurge in mid-week has coincided with a corresponding fall in the Dollar Index and increased volatility in the stock markets. But the US currency has managed to regain its poise today after the Federal Reserve Chair Janet Yellen last night re-iterated that a rate increase is forthcoming in 2015, albeit with the added caveat that the FOMC’s view may change depending on the upcoming data releases. On the front, the third and final US second quarter GDP estimate will be published later this afternoon. Unless there is an unlikely revision to the prior 3.7% annualised quarter-over-quarter reading, the dollar and therefore buck-denominated gold is unlikely to move much when the data is released at 13:30 BST (08:30 EDT).
But the greenback could be in for some increased volatility next week. Several Fed officials will be speaking in a data-packed week, including Janet Yellen herself on Wednesday. Undoubtedly, the biggest event of the week will be Friday’s US jobs report, which has shown consistent improvement over the past several months. Even so, the Fed still wants to see some further improvement in employment to be sure that the economy is on a sustainable path of recovery before hiking rates. They will also want to see signs of inflation which has been lacking thus far due mainly to the lower oil prices. But as the impact of oil prices wanes, and wage pressures grow, inflation could start to tick higher soon. If the market becomes more convinced as a result of improving US data that a rate increase is in fact imminent this year then the dollar may sharply extend its gains, as after all no other major central bank is anywhere near as hawkish as the Fed.
With the dollar potentially set to appreciate over the coming week and months, this may not be good news for some commodities that are priced in USD, such as gold and silver. That being said, both metals have recently managed to hold up relatively well despite the greenback’s renewed strength. Traders should also be wary of not overestimating the dollar’s impact on gold. They need to realise that although the physical market tends to be overshadowed by the paper, there is actual underlying supply and demand forces in play. On that front, there’s been evidence of stronger Chinese demand of late, no doubt due to the “cheaper” prices. According to data from Hong Kong government, China imported some 59.3 tons of the stuff in August and net imports were up for a second month to reach a three-month high. Gold imports from China could rise substantially from now until the Lunar New Year in early February which could support prices.
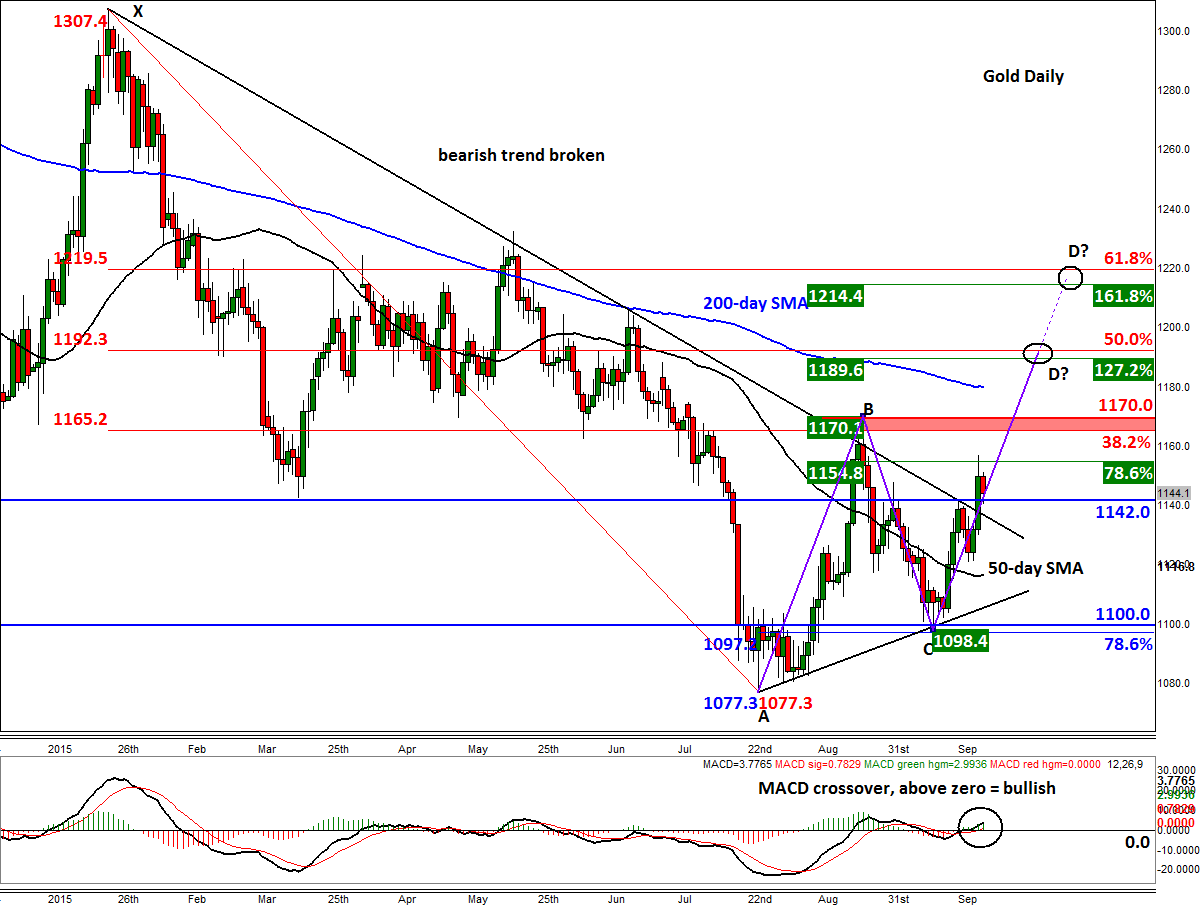
Meanwhile from a technical point of view, gold’s near-term outlook now looks bullish after it took out a 9-month-old bearish trend line following Thursday’s rally. The metal may extend its gains now if it manages to hold its own above the broken resistance level of $1140/2. If it can the bulls may then aim for the following levels next:
- $1165/70: previous resistance and 38.2% Fibonacci retracement of XA price swing.
- $1179/80: 200-day moving average
- $1190/92: point D of an ABCD pattern, 127.2% Fibonacci extension of BC and 50% retracement of XA price swings.
- $1215/20: extended point D (1.618) of an ABCD pattern, 161.8% Fibonacci extension of BC and 61.8% Fibonacci retracement of XA price swing. In other words, a Bearish Gartley entry point.
If however gold falls back below the abovementioned old resistance level of $1140/2 then this will raise some question marks over the breakout. Indeed, this could turn out to be a false break which would be a very bearish outcome. A break below support and this week’s low of $1120/1 would confirm this scenario, potentially leading further follow-up technical selling next week.
StoneX Financial Ltd (trading as “City Index”) is an execution-only service provider. This material, whether or not it states any opinions, is for general information purposes only and it does not take into account your personal circumstances or objectives. This material has been prepared using the thoughts and opinions of the author and these may change. However, City Index does not plan to provide further updates to any material once published and it is not under any obligation to keep this material up to date. This material is short term in nature and may only relate to facts and circumstances existing at a specific time or day. Nothing in this material is (or should be considered to be) financial, investment, legal, tax or other advice and no reliance should be placed on it.
No opinion given in this material constitutes a recommendation by City Index or the author that any particular investment, security, transaction or investment strategy is suitable for any specific person. The material has not been prepared in accordance with legal requirements designed to promote the independence of investment research. Although City Index is not specifically prevented from dealing before providing this material, City Index does not seek to take advantage of the material prior to its dissemination. This material is not intended for distribution to, or use by, any person in any country or jurisdiction where such distribution or use would be contrary to local law or regulation.
For further details see our full non-independent research disclaimer and quarterly summary.
CFDs are complex instruments and come with a high risk of losing money rapidly due to leverage. 69% of retail investor accounts lose money when trading CFDs with this provider. You should consider whether you understand how CFDs work and whether you can afford to take the high risk of losing your money. CFD and Forex Trading are leveraged products and your capital is at risk. They may not be suitable for everyone. Please ensure you fully understand the risks involved by reading our full risk warning.
City Index is a trading name of StoneX Financial Ltd. Head and Registered Office: 1st Floor, Moor House, 120 London Wall, London, EC2Y 5ET. StoneX Financial Ltd is a company registered in England and Wales, number: 05616586. Authorised and regulated by the Financial Conduct Authority. FCA Register Number: 446717.
City Index is a trademark of StoneX Financial Ltd.
The information on this website is not targeted at the general public of any particular country. It is not intended for distribution to residents in any country where such distribution or use would contravene any local law or regulatory requirement.
© City Index 2024